HOT TOPICS LIST
- MACD
- Fibonacci
- RSI
- Gann
- ADXR
- Stochastics
- Volume
- Triangles
- Futures
- Cycles
- Volatility
- ZIGZAG
- MESA
- Retracement
- Aroon
INDICATORS LIST
LIST OF TOPICS
PRINT THIS ARTICLE
by Chaitali Mohile
The individual equities of the Energy Select Sector fund move in a depressing mood.
Position: N/A
Chaitali Mohile
Active trader in the Indian stock markets since 2003 and a full-time writer. Trading is largely based upon technical analysis.
PRINT THIS ARTICLE
SUPPORT & RESISTANCE
XLE Resistance Obstructs Rallies In Equities
11/02/09 02:05:52 PMby Chaitali Mohile
The individual equities of the Energy Select Sector fund move in a depressing mood.
Position: N/A
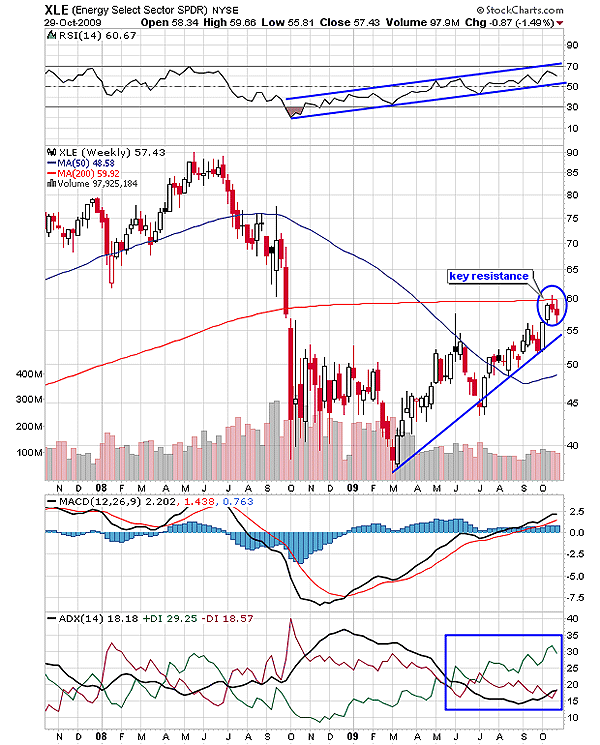
| After a long struggle, the Energy Select Sector SPDR (XLE) reached the 200-day moving average (MA) resistance. The rally took almost eight months to reach this major resistance level. A bullish engulfing candlestick pattern that occured in March 2009 was a sign that the chances of an upward rally are very high. The relative strength index (RSI) (14) has traveled a long way from an oversold region to a healthy overbought region. The average directional movement index (ADX) (14) is weak below the 20 levels, although buying pressure is high. Thus, it will be difficult for XLE to breach the 200-day MA resistance. |

|
| FIGURE 1: XLE, WEEKLY |
| Graphic provided by: StockCharts.com. |
| |
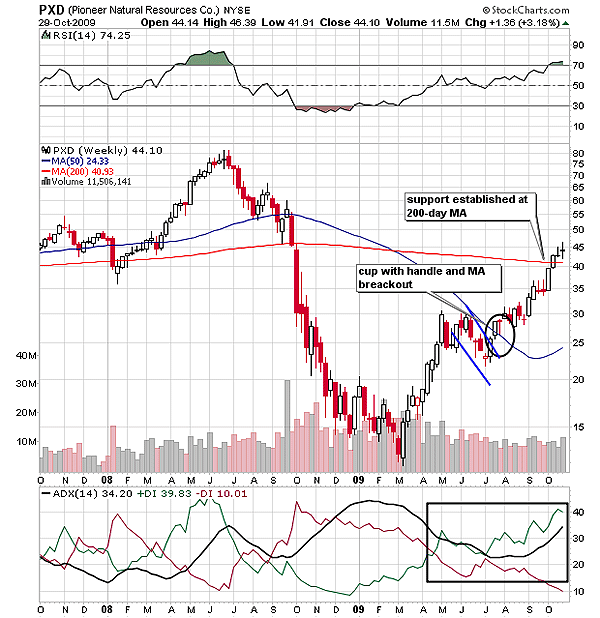
| Pioneer Natural Resources Co. (PXD) and Massey Energy Co. (MEE) are two stocks that make up XLE. PXD formed a cup with handle formation during the recovery. Since the pattern breakout and the 50-day moving average (MA) breakout occurred at similar levels, the bullish rally moved with a robust strength. With the newly formed support, PXD rushed toward another major hurdle, the 200-day MA. The size of the bullish candles are comparatively larger than the bearish candles. This reflects the bullish force in the rally. Gradually, PXD broke upward and established strong support at the 200-day MA. But we can see two doji candlesticks in Figure 2. The RSI (14) has enough room for a bullish rally and the ADX (14) is indicating a developing uptrend. Therefore, technically there was no valid reason for the doji formation. However, the 200-day MA resistance of XLE obstructed the strong bullish rally. Since PXD has sustained over the MA support, the sideways movements would not harm the future rally. |

|
| FIGURE 2: PXD, WEEKLY |
| Graphic provided by: StockCharts.com. |
| |
| But traders need to wait for a bullish breakout for XLE before initiating any long trade for PXD. |
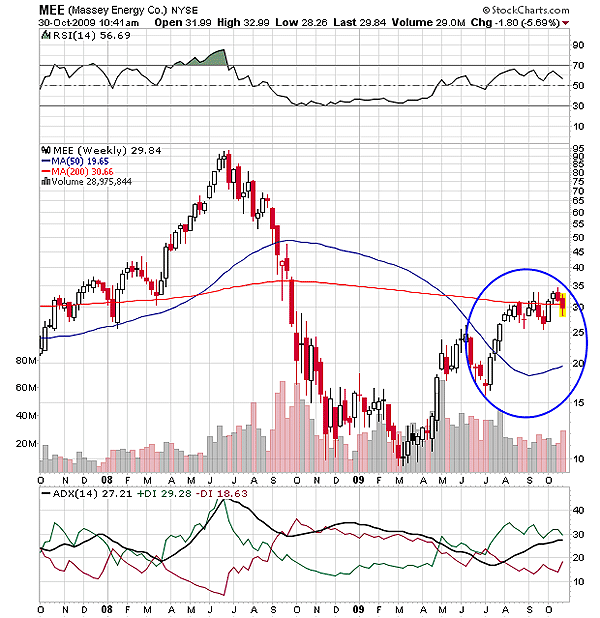
| Similarly, an upward movement of MEE turned volatile near the 200-day MA. The RSI (14) and ADX (14) are bullish; therefore, MEE was more likely to undergo a bullish consolidation. But we can see in Figure 3 that the stock is reluctant to sustain above the 200-day MA support. The XLE resistance unnerved the current rally of MEE. However, the bullish indicator would not allow MEE to retrace more but could add volatility. |

|
| FIGURE 3: MEE, WEEKLY |
| Graphic provided by: StockCharts.com. |
| |
| Thus, the resistance of XLE has obstructed the ongoing bullish rallies of PXD and MEE. These two stocks are just examples to explain the strength of resistance. There could be many such stocks from the same sector group that would have changed their directions temporarily. |
Active trader in the Indian stock markets since 2003 and a full-time writer. Trading is largely based upon technical analysis.
| Company: | Independent |
| Address: | C1/3 Parth Indraprasth Towers. Vastrapur |
| Ahmedabad, Guj 380015 | |
| E-mail address: | chaitalimohile@yahoo.co.in |
Traders' Resource Links | |
| Independent has not added any product or service information to TRADERS' RESOURCE. | |
Click here for more information about our publications!
Comments
Date: 11/03/09Rank: 1Comment:

Request Information From Our Sponsors
- VectorVest, Inc.
- Executive Premier Workshop
- One-Day Options Course
- OptionsPro
- Retirement Income Workshop
- Sure-Fire Trading Systems (VectorVest, Inc.)
- Trading as a Business Workshop
- VectorVest 7 EOD
- VectorVest 7 RealTime/IntraDay
- VectorVest AutoTester
- VectorVest Educational Services
- VectorVest OnLine
- VectorVest Options Analyzer
- VectorVest ProGraphics v6.0
- VectorVest ProTrader 7
- VectorVest RealTime Derby Tool
- VectorVest Simulator
- VectorVest Variator
- VectorVest Watchdog
- StockCharts.com, Inc.
- Candle Patterns
- Candlestick Charting Explained
- Intermarket Technical Analysis
- John Murphy on Chart Analysis
- John Murphy's Chart Pattern Recognition
- John Murphy's Market Message
- MurphyExplainsMarketAnalysis-Intermarket Analysis
- MurphyExplainsMarketAnalysis-Visual Analysis
- StockCharts.com
- Technical Analysis of the Financial Markets
- The Visual Investor
