HOT TOPICS LIST
- MACD
- Fibonacci
- RSI
- Gann
- ADXR
- Stochastics
- Volume
- Triangles
- Futures
- Cycles
- Volatility
- ZIGZAG
- MESA
- Retracement
- Aroon
INDICATORS LIST
LIST OF TOPICS
PRINT THIS ARTICLE
by Donald W. Pendergast, Jr.
With the broad market indexes falling so quickly, it helps to have a scorecard to keep up with the various rates of descent in the weakest industry groups. Some big changes appear to be in the offing.
Position: N/A
Donald W. Pendergast, Jr.
Donald W. Pendergast is a financial markets consultant who offers specialized services to stock brokers and high net worth individuals who seek a better bottom line for their portfolios.
PRINT THIS ARTICLE
HEAD & SHOULDERS
Head & Shoulders Top For FSAVX?
11/02/09 10:02:36 AMby Donald W. Pendergast, Jr.
With the broad market indexes falling so quickly, it helps to have a scorecard to keep up with the various rates of descent in the weakest industry groups. Some big changes appear to be in the offing.
Position: N/A
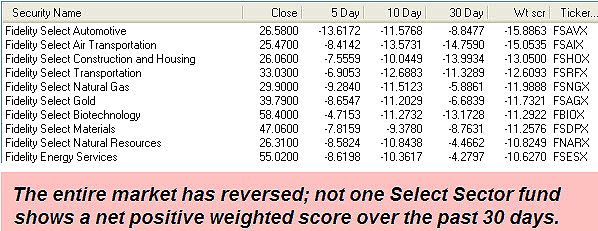
| Every trader and investor knows that sooner or later, even the strongest up (down) trend has to reverse. Who could doubt that the pair of strong, multimonth rallies (March–June 2009 and July–September 2009) are now history? What we see now is a significant trend reversal on the daily charts and major corrective moves on the weekly time frames, with some of the former leading industry groups now breaking lower with increasing intensity. Look at the 10 weakest Select Sector funds in Figure 1 and then examine an interesting chart pattern on one of the former relative strength leaders. |

|
| FIGURE 1: 10 WEAKEST SELECT SECTOR FUNDS. Trend reversals tend to be marked by broad market participation, all in the same direction, regardless of sector and industry group. All 40 Select Sector funds show a net weighted 30-day performance of less than zero percent. |
| Graphic provided by: MetaStock. |
| Graphic provided by: MetaStock Explorer. |
| |
| How quickly market situations can turn around! For months, FSAVX, the Fidelity Select Sector Automotive fund, was leading the entire market higher with an upward rate of momentum that was nearly beyond belief. Now, however, FSAVX has dropped by nearly 14% in just five days, almost 12% in 10 days and about 10% over the last month. In fact, the list of the 10 weakest funds includes a variety of industry groups ranging from biotechnology (FBIOX), air transportation (FSAIX), construction and housing (FSHOX), the entire transportation sector (FSRFX), natural gas (FSNGX), gold (FSAGX), the entire materials sector (FSDPX), natural resources (FNARX), and energy services (FSESX). All of these funds appear to have made significant intermediate-term tops and now need to correct for some time before beginning any further attempts to move above the September–October 2009 highs. Even the funds showing the greatest 30-day relative strength are all in the red, including the consumer staples sector (FDFAX), software and computer services (FSCSX), and the pharmaceuticals (FPHAX)industry groups. Since there are 40+ funds in the Select Sector universe, having all of them in the red over the past 30-day market period looks to be a very significant situation, one indicating a high level of fear and uncertainty among many market participants. |

|
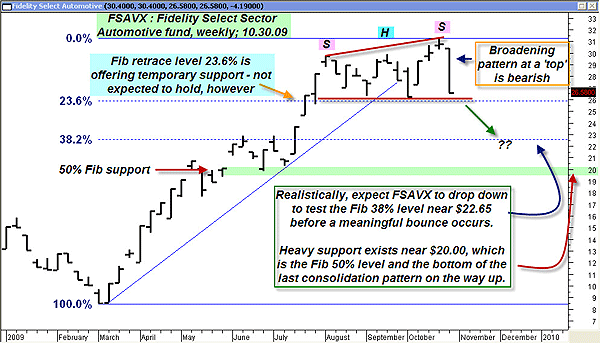
| FIGURE 2: FSAVX, WEEKLY. This chart strongly suggests that FSAVX is likely to experience more downside price movement, and sooner rather than later. |
| Graphic provided by: MetaStock. |
| |
| Figure 2 is the weekly chart for FSAVX, the one with a fairly pronounced head & shoulders pattern evident. It's buried within a broadening formation, one occurring after a seven-month long weekly uptrend move that looks as if it's about given up the ghost. The bottom of the pattern coincides with the Fibonacci 23.6% retracement level, a support level that normally offers minor resistance during the first stages of a trend reversal. This level rarely holds at major reversals, however, and usually gives way as a fresh round of selling ensues on the break of support. Realistically, on any further weakness, it would be prudent to expect FSAVX to run down at least to the $22.65 area (the Fibonacci 38% retracement) before finding meaningful support. And if the broad markets really fall out of bed, a run down toward $20 can't be ruled out, either. Fortunately, that price area contains the Fibonacci 50% retracement and significant chart support as well and should be an area to expect a bounce/reversal, should it go that low. Overall, it's a very simple chart we're looking at, one that is telegraphing oodles of useful information to traders with eyes to see what's shaping up. A major weekly low isn't due in the Standard & Poor's 500 and Russell 2000 indexes for at least another two to three weeks, so it wouldn't be surprising to see some minor rebound action in the markets this week, followed by some more hard action to the downside. November should be at least as interesting as September and October were, and possibly even more so. Regardless of what actually ensues this month, well-prepared traders and investors should be more than able to profit and/or sidestep any further market downdrafts. |
Donald W. Pendergast is a financial markets consultant who offers specialized services to stock brokers and high net worth individuals who seek a better bottom line for their portfolios.
| Title: | Writer, market consultant |
| Company: | Linear Trading Systems LLC |
| Jacksonville, FL 32217 | |
| Phone # for sales: | 904-239-9564 |
| E-mail address: | lineartradingsys@gmail.com |
Traders' Resource Links | |
| Linear Trading Systems LLC has not added any product or service information to TRADERS' RESOURCE. | |
Click here for more information about our publications!
Comments
Date: 11/03/09Rank: 3Comment:

Request Information From Our Sponsors
- StockCharts.com, Inc.
- Candle Patterns
- Candlestick Charting Explained
- Intermarket Technical Analysis
- John Murphy on Chart Analysis
- John Murphy's Chart Pattern Recognition
- John Murphy's Market Message
- MurphyExplainsMarketAnalysis-Intermarket Analysis
- MurphyExplainsMarketAnalysis-Visual Analysis
- StockCharts.com
- Technical Analysis of the Financial Markets
- The Visual Investor
- VectorVest, Inc.
- Executive Premier Workshop
- One-Day Options Course
- OptionsPro
- Retirement Income Workshop
- Sure-Fire Trading Systems (VectorVest, Inc.)
- Trading as a Business Workshop
- VectorVest 7 EOD
- VectorVest 7 RealTime/IntraDay
- VectorVest AutoTester
- VectorVest Educational Services
- VectorVest OnLine
- VectorVest Options Analyzer
- VectorVest ProGraphics v6.0
- VectorVest ProTrader 7
- VectorVest RealTime Derby Tool
- VectorVest Simulator
- VectorVest Variator
- VectorVest Watchdog
