HOT TOPICS LIST
- MACD
- Fibonacci
- RSI
- Gann
- ADXR
- Stochastics
- Volume
- Triangles
- Futures
- Cycles
- Volatility
- ZIGZAG
- MESA
- Retracement
- Aroon
INDICATORS LIST
LIST OF TOPICS
PRINT THIS ARTICLE
by Chaitali Mohile
Is the developed uptrend of Atlas Energy on edge to reverse?
Position: Buy
Chaitali Mohile
Active trader in the Indian stock markets since 2003 and a full-time writer. Trading is largely based upon technical analysis.
PRINT THIS ARTICLE
CANDLESTICK CHARTING
Atlas Energy Lost Previous Gains
10/30/09 09:56:15 AMby Chaitali Mohile
Is the developed uptrend of Atlas Energy on edge to reverse?
Position: Buy
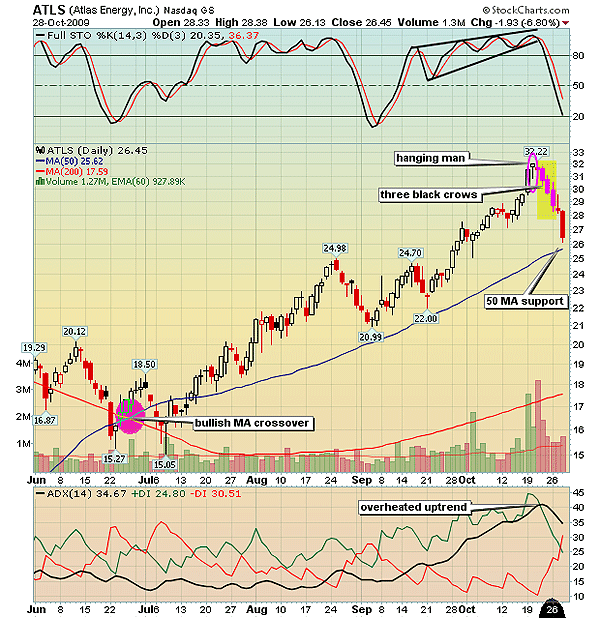
| In Figure 1 of Atlas Energy (ATLS), the 50-day moving average (MA) crossed above the 200-day MA, showing a bullish moving average crossover. The MA crossover and an oversold full stochastic (14,3,3) indicated that a bullish rally could be expected. As you can see, a bullish rally started from $17. Thereafter, the stock followed the 50-day MA and soon reached $32, gaining a profit of $15. During the rally, the 50-day support was challenged twice. Meanwhile, the weak average directional movement index (ADX) (14) that moved below the 20 levels surged with huge buying pressure. During the second retest of the 50-day MA support, an uptrend was developed. We can see that as the bullish trend turned stronger, the rally gained the bullish strength and never rushed downward to retest the MA support. |

|
| FIGURE 1: ATLS, DAILY. The hanging man followed by the three black crows dragged the stock lower. |
| Graphic provided by: StockCharts.com. |
| |
| By the time ATLS reached $32, the stochastic oscillator turned highly overbought and the ADX (14) hit an overheated uptrend level at 40. This suggested that both indicators could reverse very soon, which they did. The same was reflected on the price chart by the bearish reversal candlestick pattern. The first candle that indicated a topping-out situation was a small hanging man formation (purple oval in Figure 1). Since the candle is single and small in size, you need more confirmation for profit booking signs. The following candle was a normal doji that opened below the previous day's close, highlighting indecision to carry the rally higher. But the third full bearish candle cleared all the clouds of uncertainty and marked the bearish direction for the stock price. Thereafter, ATLS continued to drop to new lows and formed a three black crow bearish candlestick formation. We can see that the second and the third candle in the yellow circle opened near the previous close and the session ended at new lows. Therefore, the formation was a valid bearish trend reversal candlestick pattern. |
| The full stochastic (14,3,3) had a nosedive as price slipped down to $26. The buying pressure indicated by the positive directional index (+DI) reduced and the ADX (14) moved in a comfortable developed uptrend region. ATLS has moved closer to the 50-day MA support at $25.62. Many times, the 50-day MA offers strong support to the corrective rally, preventing additional losses to the value of a stock or index. If the stock establishes support and moves upward, the correction is considered to be short term. ATLS has moved into a very sensitive area. If the selling pressure shown by the negative directional index (-DI) turns stronger than the +DI, then the uptrend would feel the bearish heat temporarily. But since the stochastic oscillator has reached 20 levels, the stock is likely to establish support at the 50-day MA. |
| Therefore, currently the technical chart does not indicate any significant bearish trend reversal signals. The bullish twist from the 50-day MA can be good place to trigger the long positions. |
Active trader in the Indian stock markets since 2003 and a full-time writer. Trading is largely based upon technical analysis.
| Company: | Independent |
| Address: | C1/3 Parth Indraprasth Towers. Vastrapur |
| Ahmedabad, Guj 380015 | |
| E-mail address: | chaitalimohile@yahoo.co.in |
Traders' Resource Links | |
| Independent has not added any product or service information to TRADERS' RESOURCE. | |
Click here for more information about our publications!
PRINT THIS ARTICLE

Request Information From Our Sponsors
- StockCharts.com, Inc.
- Candle Patterns
- Candlestick Charting Explained
- Intermarket Technical Analysis
- John Murphy on Chart Analysis
- John Murphy's Chart Pattern Recognition
- John Murphy's Market Message
- MurphyExplainsMarketAnalysis-Intermarket Analysis
- MurphyExplainsMarketAnalysis-Visual Analysis
- StockCharts.com
- Technical Analysis of the Financial Markets
- The Visual Investor
- VectorVest, Inc.
- Executive Premier Workshop
- One-Day Options Course
- OptionsPro
- Retirement Income Workshop
- Sure-Fire Trading Systems (VectorVest, Inc.)
- Trading as a Business Workshop
- VectorVest 7 EOD
- VectorVest 7 RealTime/IntraDay
- VectorVest AutoTester
- VectorVest Educational Services
- VectorVest OnLine
- VectorVest Options Analyzer
- VectorVest ProGraphics v6.0
- VectorVest ProTrader 7
- VectorVest RealTime Derby Tool
- VectorVest Simulator
- VectorVest Variator
- VectorVest Watchdog
