HOT TOPICS LIST
- MACD
- Fibonacci
- RSI
- Gann
- ADXR
- Stochastics
- Volume
- Triangles
- Futures
- Cycles
- Volatility
- ZIGZAG
- MESA
- Retracement
- Aroon
INDICATORS LIST
LIST OF TOPICS
PRINT THIS ARTICLE
by Chaitali Mohile
Chasing the highs of 2007-08 was a major challenge for almost all the individual stocks as well as for the indexes. Kimberly Clark was one of the stocks that came up roaring and reached the previous high. Will the stock violate the resistance or will it retrace back?
Position: N/A
Chaitali Mohile
Active trader in the Indian stock markets since 2003 and a full-time writer. Trading is largely based upon technical analysis.
PRINT THIS ARTICLE
SUPPORT & RESISTANCE
Kimberly Clark Hits Resistance
10/30/09 09:23:58 AMby Chaitali Mohile
Chasing the highs of 2007-08 was a major challenge for almost all the individual stocks as well as for the indexes. Kimberly Clark was one of the stocks that came up roaring and reached the previous high. Will the stock violate the resistance or will it retrace back?
Position: N/A
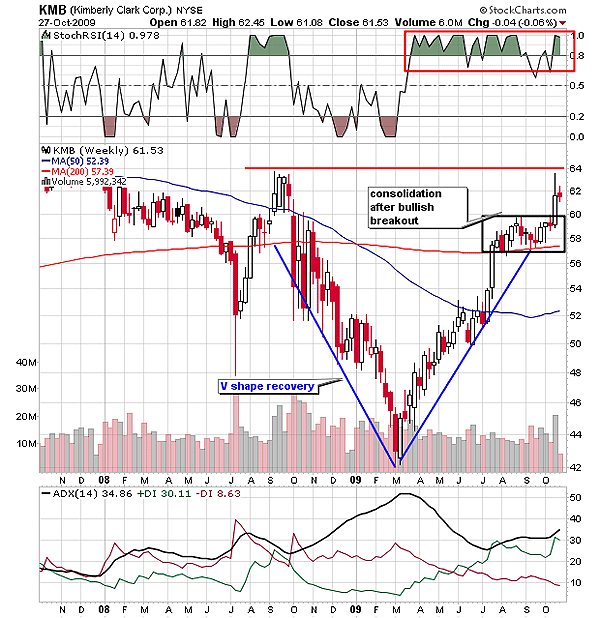
| Kimberly Clark Corp. (KMB) witnessed a V-shaped recovery with strong volume. On the weekly chart in Figure 1, every bullish week was followed by either a consolidated or marginally downward move. This developed great stability in the rally and KMB violated the 200-day moving average (MA) resistance, the toughest long-term resistance. A declining downtrend from an overheated area poured the essential buying pressure in the bullish move. The average directional movement index (ADX) (14) plunged to 20 levels from the overheated zone in Figure 1. A bullish reversal rally of KMB was born. As the 200-day MA was converted to support, the ADX (14) surged in the bulls' favor, and gradually, an uptrend was developed. The consolidation with the support of 200-day MA formed a bullish flag & pennant formation, indicating more room for an upward breakout rally. |

|
| FIGURE 1: KMB, WEEKLY. The stock retraced to the previous closing after hitting the previous high resistance. |
| Graphic provided by: StockCharts.com. |
| |
| After establishing support at the 50-day MA near $52, KMB underwent an upward move consecutively for two weeks. Therefore, the advance rally from $52 to $58 can be considered to be a flagpole for the flag & pennant continuation formation. Thus, the breakout target for the pattern is 58 - 52 = 6 + 60 = 66. But before hitting the potential target of $66, KMB had to breach the prior top of 2008 at $64. The stock made an effort to hit resistance; however, KMB dropped below the high, developing a long shadow candle. The overbought stochRSI (14) regained the strength and surged into an overbought zone. Although KMB has retraced to the previous week's closing level, the developing uptrend and bullish stochRSI (14) would prevent additional damage. |

|
| FIGURE 2: KMB, DAILY. Due to the overheated uptrend, KMB corrected from $60 and later established support at 50-day MA. As the ADX (14) reached 20 levels, the selling pressure tried to suppress the bulls but failed. |
| Graphic provided by: StockCharts.com. |
| |
| According to Figure 2, KMB made a high at $60 and plunged establishing support at the 50-day MA. The bullish rally with the MA support climbed steeply upward in a short-term channel till the stock reached $60. A gap up breached the previous high resistance and led the stock to another high. During the price rally within the channel, the stochRSI (14) was very volatile and moved between the bullish zone of 0.5 and 1.0. However, the oscillator slipped below the 0.5 level as KMB dropped from $64. About 50% of the gap has been filled, but if the stock retraced further, the entire gap could be filled. |
| Currently, the financial markets have turned volatile and it is likely that the gap may get filled. This can be a low-risk buying opportunity for traders with the previous highs as targets. |
Active trader in the Indian stock markets since 2003 and a full-time writer. Trading is largely based upon technical analysis.
| Company: | Independent |
| Address: | C1/3 Parth Indraprasth Towers. Vastrapur |
| Ahmedabad, Guj 380015 | |
| E-mail address: | chaitalimohile@yahoo.co.in |
Traders' Resource Links | |
| Independent has not added any product or service information to TRADERS' RESOURCE. | |
Click here for more information about our publications!
Comments

Request Information From Our Sponsors
- StockCharts.com, Inc.
- Candle Patterns
- Candlestick Charting Explained
- Intermarket Technical Analysis
- John Murphy on Chart Analysis
- John Murphy's Chart Pattern Recognition
- John Murphy's Market Message
- MurphyExplainsMarketAnalysis-Intermarket Analysis
- MurphyExplainsMarketAnalysis-Visual Analysis
- StockCharts.com
- Technical Analysis of the Financial Markets
- The Visual Investor
- VectorVest, Inc.
- Executive Premier Workshop
- One-Day Options Course
- OptionsPro
- Retirement Income Workshop
- Sure-Fire Trading Systems (VectorVest, Inc.)
- Trading as a Business Workshop
- VectorVest 7 EOD
- VectorVest 7 RealTime/IntraDay
- VectorVest AutoTester
- VectorVest Educational Services
- VectorVest OnLine
- VectorVest Options Analyzer
- VectorVest ProGraphics v6.0
- VectorVest ProTrader 7
- VectorVest RealTime Derby Tool
- VectorVest Simulator
- VectorVest Variator
- VectorVest Watchdog
