HOT TOPICS LIST
- MACD
- Fibonacci
- RSI
- Gann
- ADXR
- Stochastics
- Volume
- Triangles
- Futures
- Cycles
- Volatility
- ZIGZAG
- MESA
- Retracement
- Aroon
INDICATORS LIST
LIST OF TOPICS
PRINT THIS ARTICLE
by Koos van der Merwe
"It must be the Yankees, why else is the Dow down?" says Jim Cramer on CNBC.
Position: Hold
Koos van der Merwe
Has been a technical analyst since 1969, and has worked as a futures and options trader with First Financial Futures in Johannesburg, South Africa.
PRINT THIS ARTICLE
TREND-CHANNEL
A Strong Dow Resistance Level
10/29/09 08:26:56 AMby Koos van der Merwe
"It must be the Yankees, why else is the Dow down?" says Jim Cramer on CNBC.
Position: Hold
| The Dow Jones Industrial Average (DJIA) is up 11% for the year, and with tax-loss selling around the corner, we may have seen the highs for the year. The strong resistance trendline certainly seems to suggest it. |

|
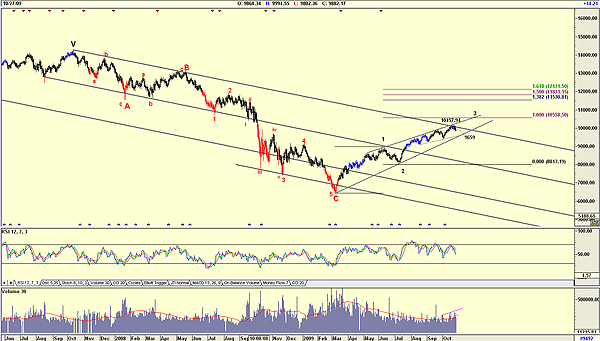
| FIGURE 1: DJIA, DAILY. The DJIA has major trendlines. |
| Graphic provided by: AdvancedGET. |
| |
| Figure 1 is a daily chart of the DJIA with an Elliott wave count that I believe is correct. This means that wave 3 should be equal or greater than wave 1, which puts its target at 10,558.50 at the minimum. However, the downsloping trendline has acted as a significant resistance level with the DJIA at 10,167.The chart shows how the DJIA hugged the trendline for four days before breaking away and falling. Should it fall parallel to wave 2 on the chart, it should find support on the lower support line at 9659. This level is further highlighted by the shorter support line along the recent lows that dissects the main support line at this level. Could the correction that the DJIA is now experiencing be a wave 4? I hope so, because if it is, then it should be a simple correction to the main support line. This will mean that wave 3 is shorter than wave 1 and that wave 5 will be shorter than wave 3. This also means that the correction after wave 5, which I believe could be a major wave II with the waves 1–5 being the major wave I, will be a minor correction, and not the 72% correction that wave 2s could be. This then means that the expected double-dip recession will not occur, and if it does, it will be minor and of short duration. Volume was rising as the DJIA rose and has fallen as the DJIA has fallen. This is very much a bullish signal. The DJIA is testing a major resistance level. I could turn and break above it, or it could continue down to find support at 9659 before moving up. I hope for the latter, because then it means that a double-dip recession, as measured by a major wave II, will be minor. |
Has been a technical analyst since 1969, and has worked as a futures and options trader with First Financial Futures in Johannesburg, South Africa.
| Address: | 3256 West 24th Ave |
| Vancouver, BC | |
| Phone # for sales: | 6042634214 |
| E-mail address: | petroosp@gmail.com |
Click here for more information about our publications!
PRINT THIS ARTICLE

Request Information From Our Sponsors
- StockCharts.com, Inc.
- Candle Patterns
- Candlestick Charting Explained
- Intermarket Technical Analysis
- John Murphy on Chart Analysis
- John Murphy's Chart Pattern Recognition
- John Murphy's Market Message
- MurphyExplainsMarketAnalysis-Intermarket Analysis
- MurphyExplainsMarketAnalysis-Visual Analysis
- StockCharts.com
- Technical Analysis of the Financial Markets
- The Visual Investor
- VectorVest, Inc.
- Executive Premier Workshop
- One-Day Options Course
- OptionsPro
- Retirement Income Workshop
- Sure-Fire Trading Systems (VectorVest, Inc.)
- Trading as a Business Workshop
- VectorVest 7 EOD
- VectorVest 7 RealTime/IntraDay
- VectorVest AutoTester
- VectorVest Educational Services
- VectorVest OnLine
- VectorVest Options Analyzer
- VectorVest ProGraphics v6.0
- VectorVest ProTrader 7
- VectorVest RealTime Derby Tool
- VectorVest Simulator
- VectorVest Variator
- VectorVest Watchdog
