HOT TOPICS LIST
- MACD
- Fibonacci
- RSI
- Gann
- ADXR
- Stochastics
- Volume
- Triangles
- Futures
- Cycles
- Volatility
- ZIGZAG
- MESA
- Retracement
- Aroon
INDICATORS LIST
LIST OF TOPICS
PRINT THIS ARTICLE
by Mike Carr, CMT
The Russell 2000 is leading the way lower in momentum. This is a warning that price may follow.
Position: N/A
Mike Carr, CMT
Mike Carr, CMT, is a member of the Market Technicians Association, and editor of the MTA's newsletter, Technically Speaking. He is also the author of "Smarter Investing in Any Economy: The Definitive Guide to Relative Strength Investing," and "Conquering the Divide: How to Use Economic Indicators to Catch Stock Market Trends."
PRINT THIS ARTICLE
RATE OF CHANGE
Stock Indexes Showing Declining Momentum
10/28/09 10:20:55 AMby Mike Carr, CMT
The Russell 2000 is leading the way lower in momentum. This is a warning that price may follow.
Position: N/A
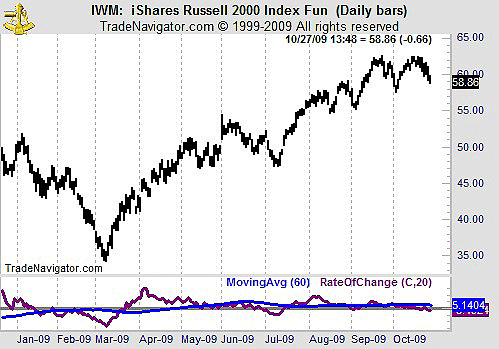
| Using rate of change (ROC) to measure momentum, we see that the upside gains in all major stock indexes may be running out of steam. Small-cap stocks have led the market higher. Looking at the Russell 2000 (Figure 1), we see that the 20-day ROC is now negative and it is below the 60-day moving average. In this case, we are looking at the 20-day ROC because 20 days is about one month (figuring in weekends). The 60-day time period represents one quarter of market action. |

|
| FIGURE 1: IWM, DAILY. Momentum failed to confirm the mid-October price rise and is now negative. |
| Graphic provided by: Trade Navigator. |
| |
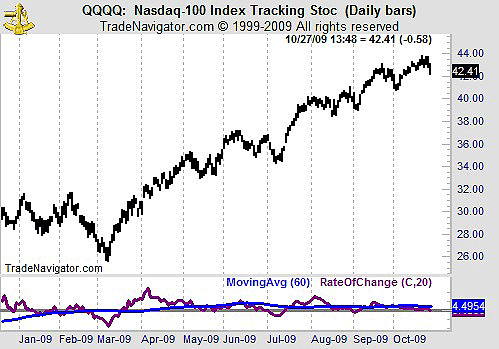
| Tech stocks were also a market leader to the upside and momentum is now barely positive (Figure 2). Movements below zero in this indicator have generally been associated with short-term price declines. |

|
| FIGURE 2: QQQQ, DAILY. The NASDAQ 100 is also showing a negative trend in momentum. |
| Graphic provided by: Trade Navigator. |
| |
| The other major indexes look the same. Now is a time to be cautious in the stock market and look for potential short opportunities. The ROC indicator has proven itself to be fairly reliable in the past and it is signaling that the bull market that started in March may be ready for its first significant retracement. |
Mike Carr, CMT, is a member of the Market Technicians Association, and editor of the MTA's newsletter, Technically Speaking. He is also the author of "Smarter Investing in Any Economy: The Definitive Guide to Relative Strength Investing," and "Conquering the Divide: How to Use Economic Indicators to Catch Stock Market Trends."
| Website: | www.moneynews.com/blogs/MichaelCarr/id-73 |
| E-mail address: | marketstrategist@gmail.com |
Click here for more information about our publications!
Comments
Date: 10/29/09Rank: 4Comment:
Date: 11/04/09Rank: 5Comment:

Request Information From Our Sponsors
- StockCharts.com, Inc.
- Candle Patterns
- Candlestick Charting Explained
- Intermarket Technical Analysis
- John Murphy on Chart Analysis
- John Murphy's Chart Pattern Recognition
- John Murphy's Market Message
- MurphyExplainsMarketAnalysis-Intermarket Analysis
- MurphyExplainsMarketAnalysis-Visual Analysis
- StockCharts.com
- Technical Analysis of the Financial Markets
- The Visual Investor
- VectorVest, Inc.
- Executive Premier Workshop
- One-Day Options Course
- OptionsPro
- Retirement Income Workshop
- Sure-Fire Trading Systems (VectorVest, Inc.)
- Trading as a Business Workshop
- VectorVest 7 EOD
- VectorVest 7 RealTime/IntraDay
- VectorVest AutoTester
- VectorVest Educational Services
- VectorVest OnLine
- VectorVest Options Analyzer
- VectorVest ProGraphics v6.0
- VectorVest ProTrader 7
- VectorVest RealTime Derby Tool
- VectorVest Simulator
- VectorVest Variator
- VectorVest Watchdog
