

HOT TOPICS LIST
- MACD
- Fibonacci
- RSI
- Gann
- ADXR
- Stochastics
- Volume
- Triangles
- Futures
- Cycles
- Volatility
- ZIGZAG
- MESA
- Retracement
- Aroon
INDICATORS LIST
LIST OF TOPICS
PRINT THIS ARTICLE
by Chaitali Mohile
Under highly bearish conditions, Honeywell began a bullish reversal rally. The stock may soon hit a long-term moving average resistance.
Position: Buy
Chaitali Mohile
Active trader in the Indian stock markets since 2003 and a full-time writer. Trading is largely based upon technical analysis.
PRINT THIS ARTICLE
DOUBLE BOTTOMS
Honeywell Likely To Cool
10/29/09 01:19:24 PMby Chaitali Mohile
Under highly bearish conditions, Honeywell began a bullish reversal rally. The stock may soon hit a long-term moving average resistance.
Position: Buy
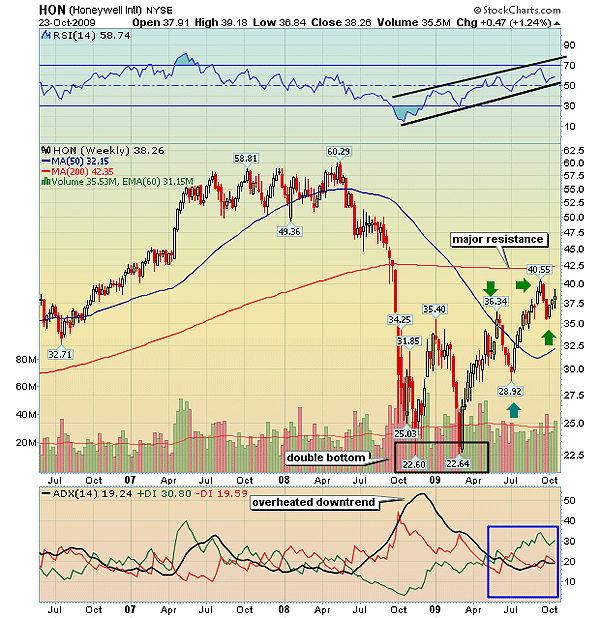
| After a double-bottom formation in 2008-09, the long-term downtrend of Honeywell (HON) reversed. A double-bottom pattern is formed when two lows appear approximately at the same levels separated by a sharp peak. HON formed both the lows almost exactly at same levels, $22.60 and $22.64. In Figure 1, the relative strength index (RSI) was highly oversold in October 2008, indicating there was a bullish reversal rally under way. The oscillator surged from the bearish area, forming first a higher high and later continued the series. A positive divergence of RSI (14) protected the further fall in price. Thus, HON formed a stable low at $22.64. In addition, an overheated downtrend shown by the average directional movement index (ADX) (14) declined, reducing the bearish pressure on the stock. Thus, the double bottom was developed in these bullish reversal situations and pulled HON higher toward a previous high resistance at $35.40. |
|
| FIGURE 1: HON, WEEKLY. The double-bottom formation reversed the huge corrective rally and initiated the fresh upward move. |
| Graphic provided by: StockCharts.com. |
| |
| Thereafter, the stock formed higher highs and higher lows, developing a bullish strength in the rally. After every higher peak, a marginally corrective rally in Figure 1 generated stability and gathered the required bullish force for the future rally. We can see that the stock gradually moved much closer to the long-term resistance of the 200-day moving average (MA). HON retraced from $40.55 before hitting the MA resistance. Similar to the earlier declines in price, this bearish rally was a good buying opportunity. We can see in Figure 1 that the volumes rose at the beginning of the bullish rally from the higher lows. But currently, the bullish rally is a bit reluctant as the 200-day MA resistance and near-term resistance of $40.55 are approaching closer. |
| The RSI (14) reached a bullish area between 50 and 70 levels and the ADX (14) is likely to move in an uptrend above the 20 levels. The swollen buying pressure would pull the trend in the bulls' favor, and consequently, HON would move ahead of the previous high. Traders can trigger a fresh long position with a very short target at the 200-day MA resistance. |
|
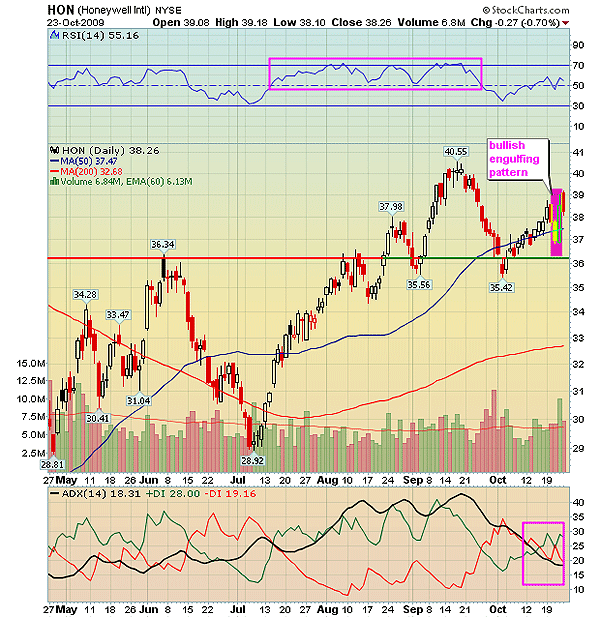
| FIGURE 2: HON, DAILY. The bullish action from the support-resistance line has formed the bullish engulfing candlestick pattern, highlighting safe bullish rally ahead. |
| Graphic provided by: StockCharts.com. |
| |
| On the daily chart in Figure 2, the RSI (14) ranged within 50 and 70 levels while price made higher highs. The indicator formed a triple top as HON hit a high at $40.55. The stock dropped to challenge the previous high at $36.34. The support-resistance tool line shows the established support at $36.34. The bullish rally from this line formed a bullish engulfing candlestick pattern with the support of the 50-day moving average (MA). The pattern shows the possibility of resuming the upward rally. The RSI (14) surged to establish support at the 50 levels, but the ADX (14) is weak. Therefore, price action is likely to take the initial steps until the prior high resistance is violated. |
| So it is possible that the speed of the rally in HON will decrease. |
Active trader in the Indian stock markets since 2003 and a full-time writer. Trading is largely based upon technical analysis.
| Company: | Independent |
| Address: | C1/3 Parth Indraprasth Towers. Vastrapur |
| Ahmedabad, Guj 380015 | |
| E-mail address: | chaitalimohile@yahoo.co.in |
Traders' Resource Links | |
| Independent has not added any product or service information to TRADERS' RESOURCE. | |
Click here for more information about our publications!
Comments
Date:�10/29/09Rank:�3Comment:�

Request Information From Our Sponsors
- VectorVest, Inc.
- Executive Premier Workshop
- One-Day Options Course
- OptionsPro
- Retirement Income Workshop
- Sure-Fire Trading Systems (VectorVest, Inc.)
- Trading as a Business Workshop
- VectorVest 7 EOD
- VectorVest 7 RealTime/IntraDay
- VectorVest AutoTester
- VectorVest Educational Services
- VectorVest OnLine
- VectorVest Options Analyzer
- VectorVest ProGraphics v6.0
- VectorVest ProTrader 7
- VectorVest RealTime Derby Tool
- VectorVest Simulator
- VectorVest Variator
- VectorVest Watchdog
- StockCharts.com, Inc.
- Candle Patterns
- Candlestick Charting Explained
- Intermarket Technical Analysis
- John Murphy on Chart Analysis
- John Murphy's Chart Pattern Recognition
- John Murphy's Market Message
- MurphyExplainsMarketAnalysis-Intermarket Analysis
- MurphyExplainsMarketAnalysis-Visual Analysis
- StockCharts.com
- Technical Analysis of the Financial Markets
- The Visual Investor