

HOT TOPICS LIST
- MACD
- Fibonacci
- RSI
- Gann
- ADXR
- Stochastics
- Volume
- Triangles
- Futures
- Cycles
- Volatility
- ZIGZAG
- MESA
- Retracement
- Aroon
INDICATORS LIST
LIST OF TOPICS
PRINT THIS ARTICLE
by Koos van der Merwe
As the H1N1 flu continues to make headlines across the world, GlaxoSmithKline is responding to the flu pandemic.
Position: Sell
Koos van der Merwe
Has been a technical analyst since 1969, and has worked as a futures and options trader with First Financial Futures in Johannesburg, South Africa.
PRINT THIS ARTICLE
OSCILLATORS
So Do You Cash In On H1N1?
10/28/09 05:04:31 PMby Koos van der Merwe
As the H1N1 flu continues to make headlines across the world, GlaxoSmithKline is responding to the flu pandemic.
Position: Sell
| Influenza has hardly been out of the headlines for the last three or so years. During 2006 the world was put on alert as cases of avian (H5N1) influenza were seen in the Middle East and Southeast Asia, causing illness and deaths in about 14 countries, and the world was frightened. The reality is that there are outbreaks of flu every winter. So-called seasonal flu is a serious condition, especially for those who are susceptible or weakened by other illnesses or old age. Each year, flu vaccine manufacturers create a vaccine that helps protect against the most likely strains of seasonal flu, and this is usually given to people at risk before or at the beginning of the annual flu season. This year, there is swine flu and influenza A (H1N1). Swine flu is a strain of flu that normally affects pigs. The strain that has been in the news during 2009 and first came to the attention of doctors when an outbreak started in Mexico during April 2009. Scientists believe that the swine flu virus, now known as influenza A (H1N1) virus because of religious objections, mutated in pigs into a form that affects humans. Since the outbreak of influenza A (H1N1) in Mexico, the virus has spread around the world with cases reported in humans in Europe, North and South America, Southeast Asia, and Australasia. People have died from the virus. GlaxoSmithKline (GSK) is investing in the development of vaccines for the influenza A (H1N1) strain of flu through its own manufacturing facilities and through partnerships with other companies. Because of this, its stock price has risen from a low of $27.15 in March 2009 to its present level of $41.60. |
|
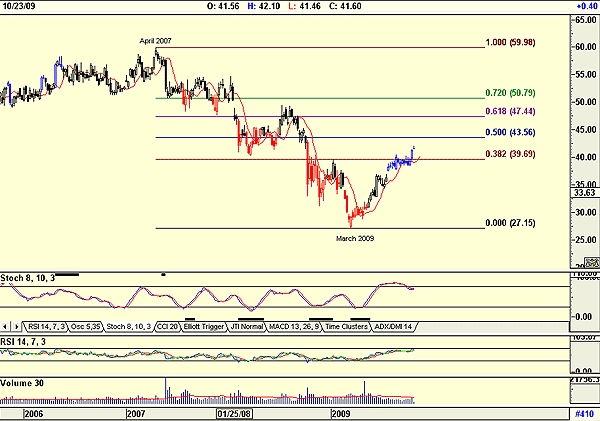
| FIGURE 1: GSK, WEEKLY |
| Graphic provided by: AdvancedGET. |
| |
| Figure 1 is a weekly chart of GSK and shows how the stock price has fallen from a high of $59.98 in April 2007 to the low of $27.15 by March 2009 along with the market meltdown. Since then, and probably because of its H1N1 research and vaccine preparation, the share price has risen as the market recovered to the current levels of $41.60, close to the 50% retracement target of $43.56. The stochastic oscillator has given a sell signal, but the relative strength index (RSI) signal is still rising. Volume, however, is below average. |
|
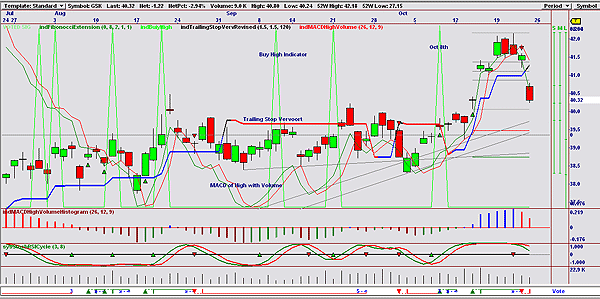
| FIGURE 2: GSK, DAILY |
| Graphic provided by: OmniTrader. |
| |
| For my daily chart (Figure 2), I have used an OmniTrader chart. I have developed my own strategies and indicators that after much research have been remarkably successful. The chart shows the following: 1. The buy high indicator. This indicator triggers when the close is greater than the high of four days ago. The indicator gave a buy signal on October 8, the same day as the vote line gave a buy signal. The price was $39.68 at that date. 2. Note that the stock price also broke above the Vervoort trailing stop suggesting a buy. This stop was written up in the June 2009 issue of STOCKS & COMMODITIES by Sylvain Vervoort in an article titled "Average True Range Trailing Stop." 3. The moving average convergence/divergence (MACD) of the high with volume. This indicator was written up in S&C in the October 2009 issue by David Hawkins. I adapted it to OmniTrader and prefer to use the MACD of the high rather than the close. This, however, does not work with a number of exchange traded funds (ETFs). However, the indicator appears remarkably accurate and is suggesting a sell as shown on the chart. 4. The histogram of David Hawkins' MACD, which has also given a sell signal. 5. The stochastic RSI cycle indicator is also negative. The formula for the indicator is available via MetaStock. 6. Volume, which is falling as the price has fallen, is suggesting strength. This does suggest that we should buy the stock as and when indicators suggest a buy signal. 7. The vote line is a culmination and sum of a number of strategies. Do note that the indicators gave a sell signal on October 22, and the stock fell heavily on October 23 as probably all chartists sold their shares. The stock is not a buy at present levels even though its vaccine against H1N1 is only now becoming available in quantity, but the share should be placed on your watchlist. |
Has been a technical analyst since 1969, and has worked as a futures and options trader with First Financial Futures in Johannesburg, South Africa.
| Address: | 3256 West 24th Ave |
| Vancouver, BC | |
| Phone # for sales: | 6042634214 |
| E-mail address: | petroosp@gmail.com |
Click here for more information about our publications!
Comments
Date:�10/29/09Rank:�3Comment:�

Request Information From Our Sponsors
- StockCharts.com, Inc.
- Candle Patterns
- Candlestick Charting Explained
- Intermarket Technical Analysis
- John Murphy on Chart Analysis
- John Murphy's Chart Pattern Recognition
- John Murphy's Market Message
- MurphyExplainsMarketAnalysis-Intermarket Analysis
- MurphyExplainsMarketAnalysis-Visual Analysis
- StockCharts.com
- Technical Analysis of the Financial Markets
- The Visual Investor
- VectorVest, Inc.
- Executive Premier Workshop
- One-Day Options Course
- OptionsPro
- Retirement Income Workshop
- Sure-Fire Trading Systems (VectorVest, Inc.)
- Trading as a Business Workshop
- VectorVest 7 EOD
- VectorVest 7 RealTime/IntraDay
- VectorVest AutoTester
- VectorVest Educational Services
- VectorVest OnLine
- VectorVest Options Analyzer
- VectorVest ProGraphics v6.0
- VectorVest ProTrader 7
- VectorVest RealTime Derby Tool
- VectorVest Simulator
- VectorVest Variator
- VectorVest Watchdog