HOT TOPICS LIST
- MACD
- Fibonacci
- RSI
- Gann
- ADXR
- Stochastics
- Volume
- Triangles
- Futures
- Cycles
- Volatility
- ZIGZAG
- MESA
- Retracement
- Aroon
INDICATORS LIST
LIST OF TOPICS
PRINT THIS ARTICLE
by Austin Passamonte
Here's the near-term to midterm outlook for SPX.
Position: N/A
Austin Passamonte
Austin is a private trader who trades emini stock index futures intraday. He currently trades various futures markets from home in addition to managing a trader's educational forum
PRINT THIS ARTICLE
TECHNICAL ANALYSIS
Can SPX Handle 1200?
10/27/09 03:53:09 PMby Austin Passamonte
Here's the near-term to midterm outlook for SPX.
Position: N/A
| The past 12 months have been one extreme ride for stock market indexes. From the epic crash of September–October 2008 through the grinding plod upward of 2009, it has been a year of market extremes. |

|
| FIGURE 1: SPX, WEEKLY |
| Graphic provided by: TradeStation. |
| |
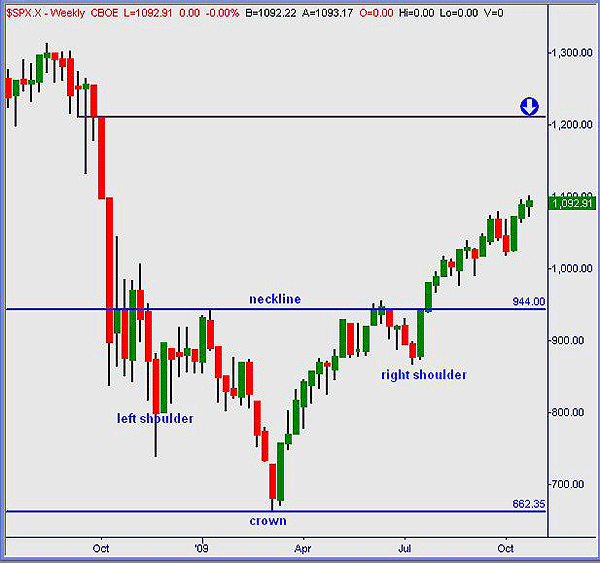
| The weekly chart view in Figure 1 shows a big inverted head & shoulders pattern: the crown at the 662 zone with neckline resistance around 944. Taking the sum of distance between crown and neckline = 282 index points' width. Adding that sum to the 944 breakout zone = 1226 as an upside price target to come. |

|
| FIGURE 2: SPX, DAILY |
| Graphic provided by: TradeStation. |
| |
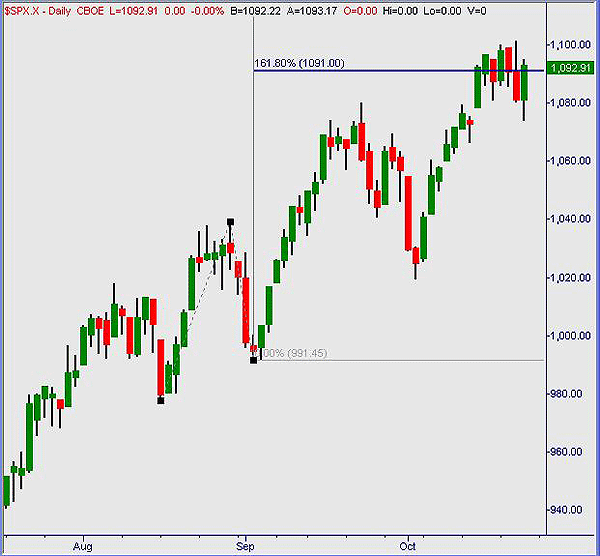
| In the near term, SPX has met a price projection of resistance around the 1090 level. Seven sessions in succession have found themselves stuck right there. Increasing volatility in the past days is a clear indication that price will push away soon ... up or down. See Figure 2. |

|
| FIGURE 3: SPX, DAILY |
| Graphic provided by: TradeStation. |
| |
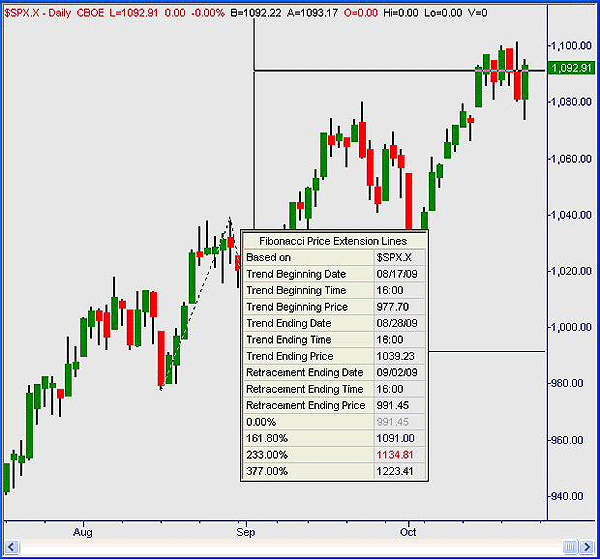
| If "up" is the resolution from here, next stops on the projection circuit would be 1130+ and then 1220+ zones. There is that 1200+ price objective again, a different measure but the same target. |

|
| FIGURE 4: SPX, DAILY |
| Graphic provided by: TradeStation. |
| |
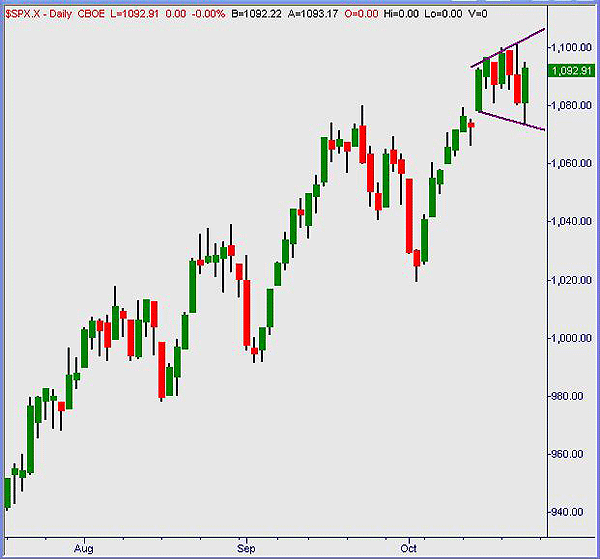
| One last look from a slightly different perspective: past seven sessions since the last breakout ascent have floundered sideways in a widening megaphone pattern (Figure 3). The subsequent break of this wedge, up or down, will confirm what comes next. Look for the closing bar outside this pattern for a strong sign of which way to go next; 1200 is possible, but a sharp pullback is equally probable. |
Austin is a private trader who trades emini stock index futures intraday. He currently trades various futures markets from home in addition to managing a trader's educational forum
| Title: | Individual Trader |
| Company: | CoiledMarkets.com |
| Address: | PO Box 633 |
| Naples, NY 14512 | |
| Website: | coiledmarkets.com/blog |
| E-mail address: | austinp44@yahoo.com |
Traders' Resource Links | |
| CoiledMarkets.com has not added any product or service information to TRADERS' RESOURCE. | |
Click here for more information about our publications!
Comments
Date: 10/28/09Rank: 5Comment:

Request Information From Our Sponsors
- StockCharts.com, Inc.
- Candle Patterns
- Candlestick Charting Explained
- Intermarket Technical Analysis
- John Murphy on Chart Analysis
- John Murphy's Chart Pattern Recognition
- John Murphy's Market Message
- MurphyExplainsMarketAnalysis-Intermarket Analysis
- MurphyExplainsMarketAnalysis-Visual Analysis
- StockCharts.com
- Technical Analysis of the Financial Markets
- The Visual Investor
- VectorVest, Inc.
- Executive Premier Workshop
- One-Day Options Course
- OptionsPro
- Retirement Income Workshop
- Sure-Fire Trading Systems (VectorVest, Inc.)
- Trading as a Business Workshop
- VectorVest 7 EOD
- VectorVest 7 RealTime/IntraDay
- VectorVest AutoTester
- VectorVest Educational Services
- VectorVest OnLine
- VectorVest Options Analyzer
- VectorVest ProGraphics v6.0
- VectorVest ProTrader 7
- VectorVest RealTime Derby Tool
- VectorVest Simulator
- VectorVest Variator
- VectorVest Watchdog
