HOT TOPICS LIST
- MACD
- Fibonacci
- RSI
- Gann
- ADXR
- Stochastics
- Volume
- Triangles
- Futures
- Cycles
- Volatility
- ZIGZAG
- MESA
- Retracement
- Aroon
INDICATORS LIST
LIST OF TOPICS
PRINT THIS ARTICLE
by Austin Passamonte
Here's the short-term to near-term outlook for natural gas futures.
Position: N/A
Austin Passamonte
Austin is a private trader who trades emini stock index futures intraday. He currently trades various futures markets from home in addition to managing a trader's educational forum
PRINT THIS ARTICLE
TECHNICAL ANALYSIS
Natural Reserve
10/27/09 03:42:40 PMby Austin Passamonte
Here's the short-term to near-term outlook for natural gas futures.
Position: N/A
| Alongside fuel oil, natural gas has entered its strong seasonal period of demand. Like fuel oil (and coal), natural gas plays a big commercial role in energy production, heating homes, and business buildings. Natural gas (propane) also provides most of the fuel used to dry-harvest cereal grains (corn, soybeans, and so forth) from field moisture content to acceptable levels for long-term storage. Those dryer silos filled with harvested grains steaming in the autumn and winter mornings are drawing on natural gas reserves to keep our future cornflakes crunchy. |

|
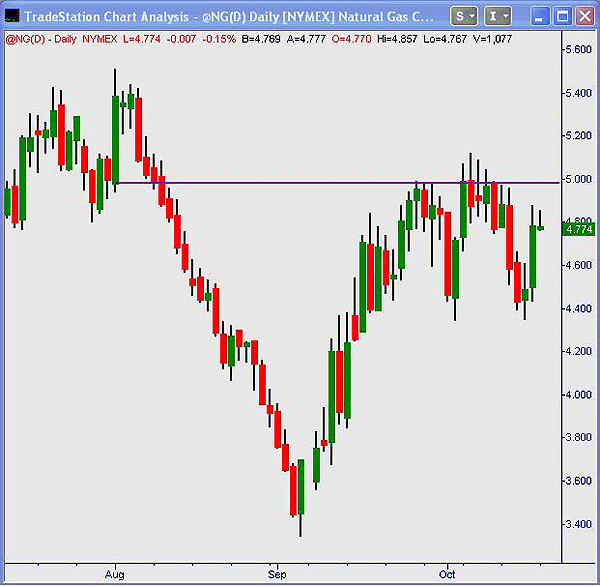
| FIGURE 1: NG, DAILY |
| Graphic provided by: TradeStation. |
| |
| The late summer swoon of natural gas prices was a deliberate drill from $5.40s to $4.30s in straight-down fashion. One thing is for sure: when commodity markets stage deliberate trend moves, they tend to do so in extreme straight-trend fashion. Figure 1 was another example of this. The $5 mark was important support before, and it has now become natural resistance. |

|
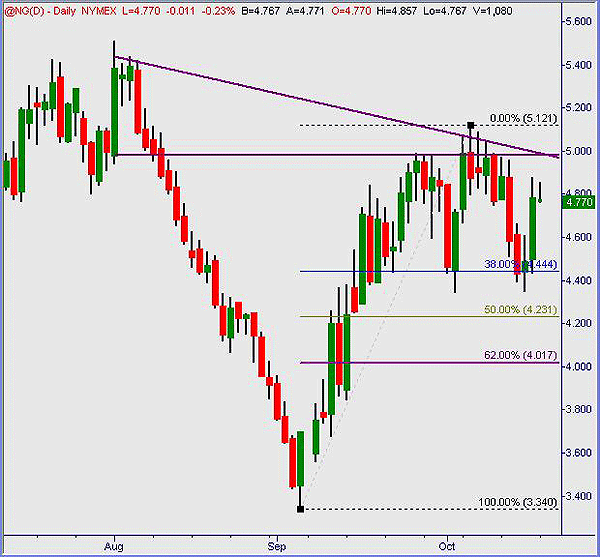
| FIGURE 2: NG, DAILY |
| Graphic provided by: TradeStation. |
| |
| Adding a couple more lines to Figure 2 shows where dual resistance measures come into play near the $5 magnet. Meanwhile, retracement supports at the usual levels of popular interest identify key layers. Of particular interest is the 50% retracement right where price action flagged and wedged roughly halfway from the initial break to subsequent lows. Price has returned to that break mark; 4.40s to 5+ should contain downside to sideways action ahead. |

|
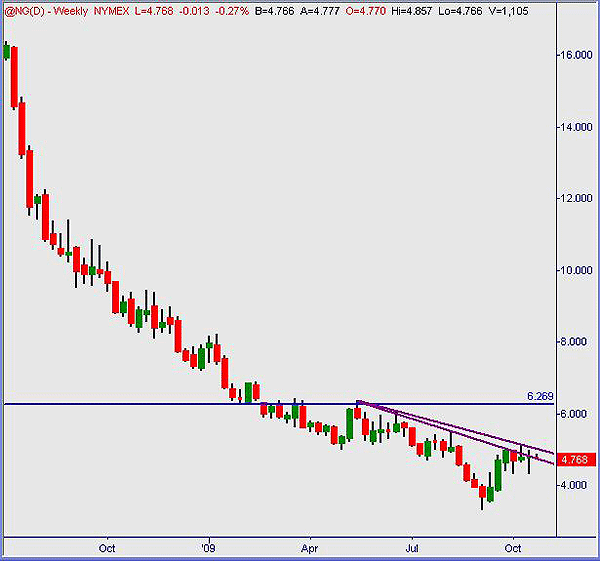
| FIGURE 3: NG, WEEKLY |
| Graphic provided by: TradeStation. |
| |
| Natty gas has a long way to go until it breaches last year's highs in the teens. No one who consumes this product in any of its various forms is anxious to see that again. Meanwhile, long-term chart downtrends project the $5 zone as thick congestion. Any successful break higher from there deals with the $6+ zone next, then multiple layers overhead above that. See Figure 3. |
| NG appears to be basing in recovery from its epic slide and shows little sign of an energized breakout potential yet. Anything can happen at any time in any financial market — rule #1 to live by. A successful push above $5 leads to $6 and then $8+ sequentially. We'll soon see what the seasonal demands have in store for longs or shorts. |
Austin is a private trader who trades emini stock index futures intraday. He currently trades various futures markets from home in addition to managing a trader's educational forum
| Title: | Individual Trader |
| Company: | CoiledMarkets.com |
| Address: | PO Box 633 |
| Naples, NY 14512 | |
| Website: | coiledmarkets.com/blog |
| E-mail address: | austinp44@yahoo.com |
Traders' Resource Links | |
| CoiledMarkets.com has not added any product or service information to TRADERS' RESOURCE. | |
Click here for more information about our publications!
Comments
Date: 10/28/09Rank: 3Comment:

Request Information From Our Sponsors
- StockCharts.com, Inc.
- Candle Patterns
- Candlestick Charting Explained
- Intermarket Technical Analysis
- John Murphy on Chart Analysis
- John Murphy's Chart Pattern Recognition
- John Murphy's Market Message
- MurphyExplainsMarketAnalysis-Intermarket Analysis
- MurphyExplainsMarketAnalysis-Visual Analysis
- StockCharts.com
- Technical Analysis of the Financial Markets
- The Visual Investor
- VectorVest, Inc.
- Executive Premier Workshop
- One-Day Options Course
- OptionsPro
- Retirement Income Workshop
- Sure-Fire Trading Systems (VectorVest, Inc.)
- Trading as a Business Workshop
- VectorVest 7 EOD
- VectorVest 7 RealTime/IntraDay
- VectorVest AutoTester
- VectorVest Educational Services
- VectorVest OnLine
- VectorVest Options Analyzer
- VectorVest ProGraphics v6.0
- VectorVest ProTrader 7
- VectorVest RealTime Derby Tool
- VectorVest Simulator
- VectorVest Variator
- VectorVest Watchdog
