HOT TOPICS LIST
- MACD
- Fibonacci
- RSI
- Gann
- ADXR
- Stochastics
- Volume
- Triangles
- Futures
- Cycles
- Volatility
- ZIGZAG
- MESA
- Retracement
- Aroon
INDICATORS LIST
LIST OF TOPICS
PRINT THIS ARTICLE
by Eric Utley
A most peculiar pattern was completed in the Nasdaq-100 (NDX) last week (10/29/01-11/2/01). Peculiar not for the pattern itself, but peculiar for the levels at which the pattern was formed. It was a head-and-shoulders pattern. And it's peculiar because it portends a retest of the September 21 lows in the Nasdaq-100.
Position: N/A
Eric Utley
Eric Utley is a professional trader and contributing editor to www.OptionInvestor.com, a web-based newsletter that serves stock and options traders. While he cannot give investment advice, Eric welcomes your questions at eutley@optioninvestor.com.
PRINT THIS ARTICLE
HEAD & SHOULDERS
The Nasdaq-100 Head-And-Shoulders
11/06/01 10:47:43 AMby Eric Utley
A most peculiar pattern was completed in the Nasdaq-100 (NDX) last week (10/29/01-11/2/01). Peculiar not for the pattern itself, but peculiar for the levels at which the pattern was formed. It was a head-and-shoulders pattern. And it's peculiar because it portends a retest of the September 21 lows in the Nasdaq-100.
Position: N/A
| The head-and-shoulders pattern is indicative of a market top. This is not to be confused with the inverted head-and-shoulders which is indicative of a market bottom. The head-and-shoulders is known as such because of its appearance on the chart. Price traces a relative high at what is known as the left shoulder. Price then retreats and traces a higher relative high at what is known as the head. The pattern is complete when price traces a lower relative high at the right shoulder, which is at or near the level of the left shoulder. Meanwhile, price tends to find support near a horizontal level known as the neckline. |
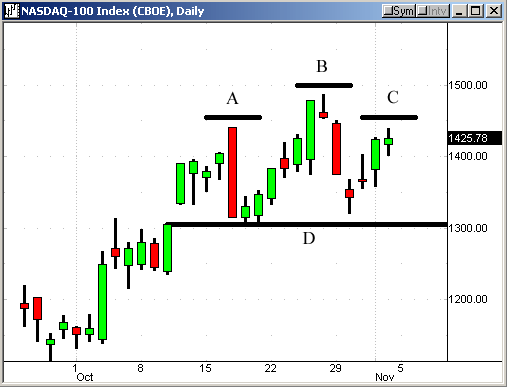
| The Daily interval chart better depicts the head-and-shoulders in the Nasdaq-100. The left shoulder (A) was traced on October 17 at the 1440 level. The head (B) of the pattern was traced on October 26 at 1487. And just last week, the right shoulder (C) was traced at 1439, a mere point away from the level of the left shoulder. The neckline (D) of the pattern is defined by the 1300 level at which the Nasdaq-100 found support between the right shoulder and head. |

|
| Figure 1: The head-and-shoulders pattern on the NASDAQ 100 Index. Point A denotes the left shoulder, point B the head, point C the right shoulder and line D the neckline. |
| Graphic provided by: Quote.com. |
| Graphic provided by: QCharts. |
| |
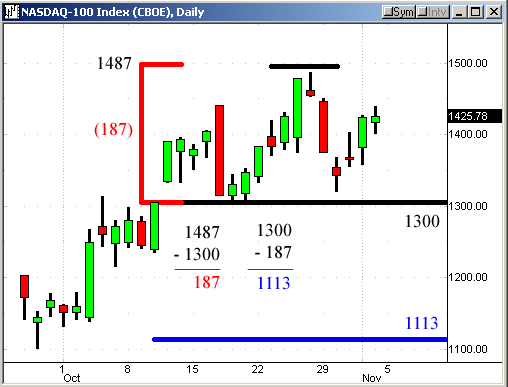
| Bearish price objectives can be calculated using the levels of a head-and-shoulders pattern. The bearish price objective is reached by taking the difference from the head and the neckline, then subtracting that difference from the neckline. Or, using the levels of the NDX's pattern: (A) 1487 (head) - 1300 (neckline) = 187; (B) 1300 (neckline) - 187 = 1113 (bearish price objective) The revised Daily interval chart better illustrates the calculation and application of the bearish price objective. Enter the peculiarity of the Nasdaq-100's current set-up: The levels of the NDX near its September 21 lows and the bearish price objective of 1113. |
 Figure 2: The head-and-shoulders pattern suggests a bearish price objective of 1113. The bearish price objective of the NDX's head-and-shoulders pattern is very close the index's September 21 lows. It's uncanny. But, is it more than a coincidence? Time will tell. Many market participants have been calling for a retest of the September 21 lows before declaring the bottom. The current set-up in the NDX seems to suggest that a retest is looming. |
| At the time of publication Eric held no positions in any securities mentioned, although holdings can change at any time. |
Eric Utley is a professional trader and contributing editor to www.OptionInvestor.com, a web-based newsletter that serves stock and options traders. While he cannot give investment advice, Eric welcomes your questions at eutley@optioninvestor.com.
| Title: | Contributing Editor |
| Company: | OptionInvestor.com |
| Website: | www.OptionInvestor.com |
| E-mail address: | eutley@optioninvestor.com |
Traders' Resource Links | |
| OptionInvestor.com has not added any product or service information to TRADERS' RESOURCE. | |
Click here for more information about our publications!
Comments
Date: 11/08/01Rank: 5Comment:
Date: 11/13/01Rank: 5Comment:
Date: 11/13/01Rank: 5Comment: I write the usefullness on 11/13 when it seems that it was a false alarm!!
Date: 11/14/01Rank: 4Comment:
Date: 11/15/01Rank: 2Comment:

Request Information From Our Sponsors
- StockCharts.com, Inc.
- Candle Patterns
- Candlestick Charting Explained
- Intermarket Technical Analysis
- John Murphy on Chart Analysis
- John Murphy's Chart Pattern Recognition
- John Murphy's Market Message
- MurphyExplainsMarketAnalysis-Intermarket Analysis
- MurphyExplainsMarketAnalysis-Visual Analysis
- StockCharts.com
- Technical Analysis of the Financial Markets
- The Visual Investor
- VectorVest, Inc.
- Executive Premier Workshop
- One-Day Options Course
- OptionsPro
- Retirement Income Workshop
- Sure-Fire Trading Systems (VectorVest, Inc.)
- Trading as a Business Workshop
- VectorVest 7 EOD
- VectorVest 7 RealTime/IntraDay
- VectorVest AutoTester
- VectorVest Educational Services
- VectorVest OnLine
- VectorVest Options Analyzer
- VectorVest ProGraphics v6.0
- VectorVest ProTrader 7
- VectorVest RealTime Derby Tool
- VectorVest Simulator
- VectorVest Variator
- VectorVest Watchdog
