HOT TOPICS LIST
- MACD
- Fibonacci
- RSI
- Gann
- ADXR
- Stochastics
- Volume
- Triangles
- Futures
- Cycles
- Volatility
- ZIGZAG
- MESA
- Retracement
- Aroon
INDICATORS LIST
LIST OF TOPICS
PRINT THIS ARTICLE
by Chaitali Mohile
The Computer Hardware Index broke upward from a short-term bearish reversal formation and induced fresh bullish energy. Let us understand the significant supports that can carry the index higher.
Position: Hold
Chaitali Mohile
Active trader in the Indian stock markets since 2003 and a full-time writer. Trading is largely based upon technical analysis.
PRINT THIS ARTICLE
WEDGE FORMATIONS
Computer Hardware Index Is Bullish
10/28/09 08:45:33 AMby Chaitali Mohile
The Computer Hardware Index broke upward from a short-term bearish reversal formation and induced fresh bullish energy. Let us understand the significant supports that can carry the index higher.
Position: Hold
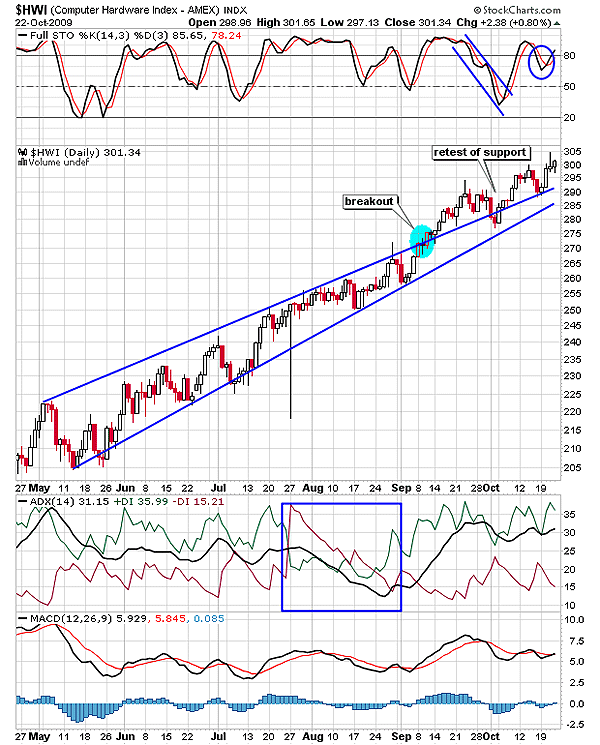
| We know that a rising wedge pattern is a bearish reversal, breaking downward. The pattern fails if the breakout occurs in an opposite direction, that is, in an upward direction and establishes new support. In Figure 1, the Computer Hardware Index ($HWI) formed a short-term rising wedge on the daily chart. The pattern formation began in May 2009 as the average directional movement index (ADX) (14) descended from a developed uptrend area at 35 levels. The trading range narrowed with the weakening bullish trend. At one point, the bears grabbed the trend; see the marked square in Figure 1. Since the bullish sentiments were much stronger, the increased buying pressure regained the trend. As a result, the rising wedge pattern that was supposed to break downside failed. |

|
| FIGURE 1: $HWI, DAILY. The rising wedge pattern failed due to the bullish breakout. The index is sustaining above the fresh trendline support. Both supports were challenged immediately after the breakout. |
| Graphic provided by: StockCharts.com. |
| |
| After the bullish breakout at 275 levels, $HWI retraced to test a newly formed trendline support. The pattern failure was the significant bullish indication for the index. The full stochastic oscillator (14,3,3) is healthily bullish, the ADX (14) is suggesting the developed uptrend, and the moving average convergence/divergence (MACD) (12,26,9) is comfortable in positive territory. Therefore, the entire scenario would drag the index higher, offering an attractive trading opportunity for the individual equities of $HWI. The upper trendline is the immediate and strongest support, followed by the lower trendline. If the index plunges to the lower trendline support, there is a possibility of the index moving in a narrow range with high volatility. In that case, traders can cut off their long positions and stay neutral until the next directional breakout. |
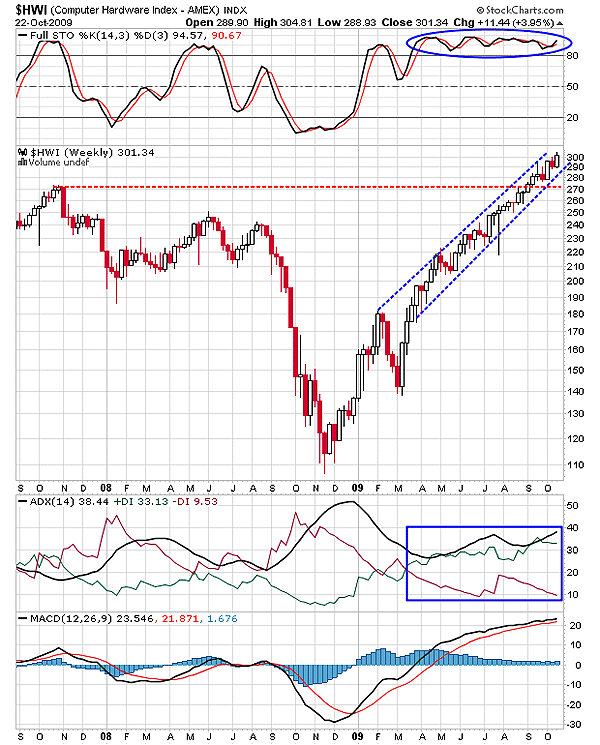
| Although the rising wedge was breached upward on the daily time frame, $HWI continued to rally in an ascending channel on the weekly time frame. According to Figure 2, the index has violated the highest peak resistance of 2007 at 270 levels and made a new high at 304 levels. The index started the bullish journey in November 2008 but the bearish trend reversed in March 2009. Since then $HWI moved vertically upward, forming an ascending channel. The uptrend developed gradually, and the full stochastic (14,3,3) moved horizontally in an overbought zone without any hesitation. The MACD (12,26,9) after a bullish crossover in negative territory has steadily surged in bullish territory above the zero line. |

|
| FIGURE 2: $HWI, WEEKLY. The real bullish strength in rally appeared in March as the downtrend reversed. The fresh rally moved up vertically, forming the ascending channel. |
| Graphic provided by: StockCharts.com. |
| |
| Therefore, $HWI is likely to continue its upward rally within the channel. The indicators are suggesting high possibility of bullish breakout from an ascending channel. Those already long can hold on to their positions. I am hesitant to recommend any fresh positions in the middle of the rally. Any decline in $HWI can be bought as all three indicators are bullish. |
| To conclude, the bearish reversal pattern failure in $HWI has generated high demand for the individual equities of the index. The long-term ascending channel readily shows the road map for future trading. |
Active trader in the Indian stock markets since 2003 and a full-time writer. Trading is largely based upon technical analysis.
| Company: | Independent |
| Address: | C1/3 Parth Indraprasth Towers. Vastrapur |
| Ahmedabad, Guj 380015 | |
| E-mail address: | chaitalimohile@yahoo.co.in |
Traders' Resource Links | |
| Independent has not added any product or service information to TRADERS' RESOURCE. | |
Click here for more information about our publications!
Comments

Request Information From Our Sponsors
- StockCharts.com, Inc.
- Candle Patterns
- Candlestick Charting Explained
- Intermarket Technical Analysis
- John Murphy on Chart Analysis
- John Murphy's Chart Pattern Recognition
- John Murphy's Market Message
- MurphyExplainsMarketAnalysis-Intermarket Analysis
- MurphyExplainsMarketAnalysis-Visual Analysis
- StockCharts.com
- Technical Analysis of the Financial Markets
- The Visual Investor
- VectorVest, Inc.
- Executive Premier Workshop
- One-Day Options Course
- OptionsPro
- Retirement Income Workshop
- Sure-Fire Trading Systems (VectorVest, Inc.)
- Trading as a Business Workshop
- VectorVest 7 EOD
- VectorVest 7 RealTime/IntraDay
- VectorVest AutoTester
- VectorVest Educational Services
- VectorVest OnLine
- VectorVest Options Analyzer
- VectorVest ProGraphics v6.0
- VectorVest ProTrader 7
- VectorVest RealTime Derby Tool
- VectorVest Simulator
- VectorVest Variator
- VectorVest Watchdog
