HOT TOPICS LIST
- MACD
- Fibonacci
- RSI
- Gann
- ADXR
- Stochastics
- Volume
- Triangles
- Futures
- Cycles
- Volatility
- ZIGZAG
- MESA
- Retracement
- Aroon
INDICATORS LIST
LIST OF TOPICS
PRINT THIS ARTICLE
by Koos van der Merwe
Batteries used in electricity powered cars are made with lithium. So you buy stock in a company that produces lithium, and if so, which company, and are you happy with your purchase?
Position: Hold
Koos van der Merwe
Has been a technical analyst since 1969, and has worked as a futures and options trader with First Financial Futures in Johannesburg, South Africa.
PRINT THIS ARTICLE
BROKERS
Running With The Hype
10/20/09 09:25:32 AMby Koos van der Merwe
Batteries used in electricity powered cars are made with lithium. So you buy stock in a company that produces lithium, and if so, which company, and are you happy with your purchase?
Position: Hold
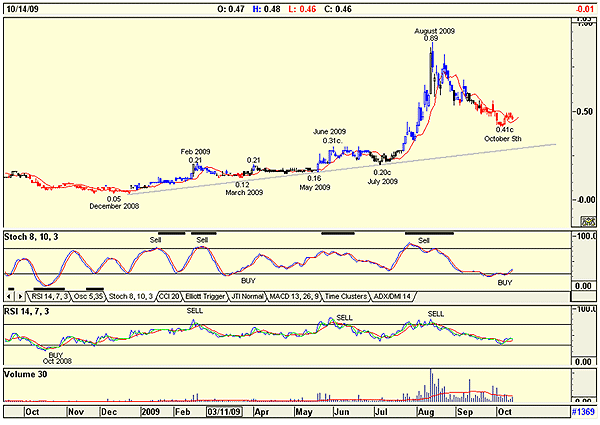
| Many start-up companies are tempting, especially when the price is less than 10 cents per share. Figure 1 is a daily chart of such a stock, Canadian Lithium (CLQ). You call up a chart and note the following: |

|
| FIGURE 1: CLQ, DAILY |
| Graphic provided by: StockCharts.com. |
| |
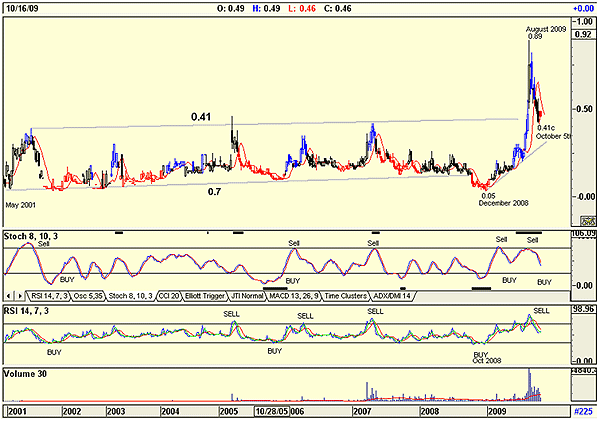
| a. In December 2008, the price was 0.05 cents per share, but very quickly rose to 0.29 per share by February 2009. Volume is light with the occasional spike, but the stock nevertheless rose over 400%. b. In February, both the stochastic and relative strength index (RSI) gave sell signals, and there were two days of strong volume, and the price then dropped to 0.12 cents by March 2009 when the stochastic oscillator gave a buy signal, not confirmed by the RSI. You decide that instead of buying tickets to the Vancouver Olympic Games for $600, you will buy 5,000 shares at 0.12 cents per shares of CLQ. c. The stock price rises to 0.21 cents and then the price moves sideways until May, dropping to 0.16 cents and you berate yourself for not having sold at 0.21 cents and then bought those Olympic tickets after all. d. Then, lo and behold, in one week the stock price jumps to 0.31 cents and you pat yourself on the back, take your profit of $950 and buy tickets for two events. e. You smile at your cleverness as the share price drops to 0.20 cents by July, noting that at this price neither the stochastic nor the RSI has given a buy signal. You then delete the stock from your watchlist. In September you go to dinner and the movies with friends. At dinner, your friend who is not a chartist says: "Thanks for that tip you gave me about that Lithium share. I sold it last week for 0.89 cents per share." You choke on the wine you are drinking. You rush home after the movie/dinner, and look at the chart, and see that no buy signal was given to suggest that the stock price would rise to such exorbitant heights. You do however note that the stochastic has given a buy signal, not confirmed by the RSI. Do you buy or don't you? Volume appears to be falling, but it is still higher than when you previously owned the stock. Then by chance you look at the weekly chart (Figure 2): |

|
| FIGURE 2: CLQ, WEEKLY |
| Graphic provided by: StockCharts.com. |
| |
| You see that indeed the share has been trading in a range of 0.7 cents to 0.41 cents since May 2001. Only recently with the rise in the market from a deep recession has the stock price risen above 0.41 cents. You ask yourself, "Is this the result of hype in a rising market, or is this real?" Caution is the better part of valor. You shrug and console yourself that the weekly oscillators are not giving buy signals, so you decide not to buy the share. But the daily chart has given a buy signal — and you have to still wonder. Is it hype, or is real? |
Has been a technical analyst since 1969, and has worked as a futures and options trader with First Financial Futures in Johannesburg, South Africa.
| Address: | 3256 West 24th Ave |
| Vancouver, BC | |
| Phone # for sales: | 6042634214 |
| E-mail address: | petroosp@gmail.com |
Click here for more information about our publications!
Comments
Date: 10/20/09Rank: 2Comment:
Date: 10/22/09Rank: 1Comment:

Request Information From Our Sponsors
- StockCharts.com, Inc.
- Candle Patterns
- Candlestick Charting Explained
- Intermarket Technical Analysis
- John Murphy on Chart Analysis
- John Murphy's Chart Pattern Recognition
- John Murphy's Market Message
- MurphyExplainsMarketAnalysis-Intermarket Analysis
- MurphyExplainsMarketAnalysis-Visual Analysis
- StockCharts.com
- Technical Analysis of the Financial Markets
- The Visual Investor
- VectorVest, Inc.
- Executive Premier Workshop
- One-Day Options Course
- OptionsPro
- Retirement Income Workshop
- Sure-Fire Trading Systems (VectorVest, Inc.)
- Trading as a Business Workshop
- VectorVest 7 EOD
- VectorVest 7 RealTime/IntraDay
- VectorVest AutoTester
- VectorVest Educational Services
- VectorVest OnLine
- VectorVest Options Analyzer
- VectorVest ProGraphics v6.0
- VectorVest ProTrader 7
- VectorVest RealTime Derby Tool
- VectorVest Simulator
- VectorVest Variator
- VectorVest Watchdog
