HOT TOPICS LIST
- MACD
- Fibonacci
- RSI
- Gann
- ADXR
- Stochastics
- Volume
- Triangles
- Futures
- Cycles
- Volatility
- ZIGZAG
- MESA
- Retracement
- Aroon
INDICATORS LIST
LIST OF TOPICS
PRINT THIS ARTICLE
by Donald W. Pendergast, Jr.
Verisign, a name familiar to all NASDAQ 100 traders, is on the move again, this time breaking sharply higher from a five-week old consolidation pattern.
Position: Buy
Donald W. Pendergast, Jr.
Donald W. Pendergast is a financial markets consultant who offers specialized services to stock brokers and high net worth individuals who seek a better bottom line for their portfolios.
PRINT THIS ARTICLE
BREAKOUTS
Verisign Breaks Higher From Consolidation
10/20/09 08:58:34 AMby Donald W. Pendergast, Jr.
Verisign, a name familiar to all NASDAQ 100 traders, is on the move again, this time breaking sharply higher from a five-week old consolidation pattern.
Position: Buy
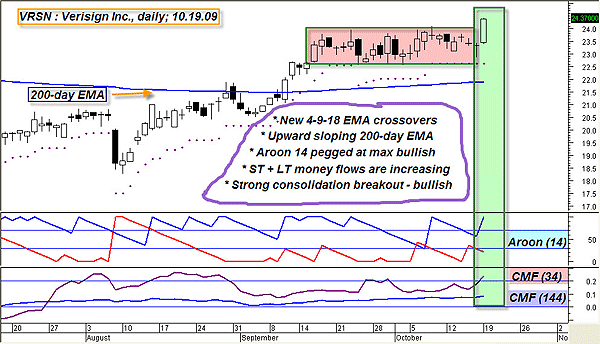
| Verisign (VRSN) has become a household name brand to anyone who uses the Internet on a regular basis. For traders, however, the real attraction with this brand name is in the current bullish price action on VRSN's daily stock chart, which we'll examine in detail. See Figure 1. |

|
| FIGURE 1: VRSN, DAILY. Breakouts can be fickle, but when trend, money flow, momentum, and fundamentals are aligned in bullish agreement, taking a long breakout trade entry becomes that much easier. |
| Graphic provided by: MetaStock. |
| |
| Essentially, in VRSN we see a stock with outstanding short- and long-term money flows — the Chaikin (34) and (144) money flow indicators, plotted at the bottom of the chart — one that has printed a noticeable bullish break higher from a five-week consolidation pattern. In addition, the stock is well above its 200-day exponential moving average (EMA) and that particular EMA has begun to slope upward — a lagging (but still welcome) confirmation of a bull trend in any given stock or commodity. Going further, the Aroon trend intensity indicator (set at 14 periods) has swung back to the top of its range, yet another sign that VRSN may be preparing for a period of sustained gains. As if all of that wasn't enough confirmation for VRSN bulls to go long, the stock has also just completed a 4-9-18 EMA crossover (fast version: prices are above all EMAs, with the four-period EMA crossing the nine-period EMA to the upside, even if the 18-period EMA has not been cleared by either of the shorter EMAs), which is especially bullish in the light of the strong trend, money flow, and breakout characteristics currently shown on the chart. Verisign is also blessed on the fundamental side of the ledger as well; the stock's average earnings estimates are on track for consistent growth for at least the next 12 to 14 months, as are its earnings per share (EPS) growth rates for the same time frame. |
| Playing VRSN is very simple. If you're aggressive and impatient, you go all-in on the next session's open, running a three-bar trailing stop of the lows as your "get out, I'm wrong" point. If you're more cautious, consider putting half on at the next session's open and then waiting for a minor intraday pullback on a 15- to 30-minute chart to load on the second half of your position. Be aware that the stock has meaningful resistance at $24.53 and then again at $24.88 (the May/June 2009 daily swing highs), so watch the reaction of the stock, should it hit either price for clues about the power of the underlying trend in the shares of this stock. If you see it plow through either area on high-volume and wide intraday ranges, you might even consider bumping up the size of your position a bit, especially since the stock won't hit strong resistance again until $25.83, the current location of VRSN's 50-week EMA. Should the stock get that far, taking some profits off the table would be an excellent idea, particularly with the current broad market rally beginning to flash a few early warning signs that some sort of a pause and/or consolidation is due. After taking half profits (should prices hit $25.83 or more), consider running a two-bar trailing stop of the lows to make sure that you get your well-deserved piece of the Verisign pie. |
Donald W. Pendergast is a financial markets consultant who offers specialized services to stock brokers and high net worth individuals who seek a better bottom line for their portfolios.
| Title: | Writer, market consultant |
| Company: | Linear Trading Systems LLC |
| Jacksonville, FL 32217 | |
| Phone # for sales: | 904-239-9564 |
| E-mail address: | lineartradingsys@gmail.com |
Traders' Resource Links | |
| Linear Trading Systems LLC has not added any product or service information to TRADERS' RESOURCE. | |
Click here for more information about our publications!
Comments
Date: 10/20/09Rank: 4Comment:

Request Information From Our Sponsors
- StockCharts.com, Inc.
- Candle Patterns
- Candlestick Charting Explained
- Intermarket Technical Analysis
- John Murphy on Chart Analysis
- John Murphy's Chart Pattern Recognition
- John Murphy's Market Message
- MurphyExplainsMarketAnalysis-Intermarket Analysis
- MurphyExplainsMarketAnalysis-Visual Analysis
- StockCharts.com
- Technical Analysis of the Financial Markets
- The Visual Investor
- VectorVest, Inc.
- Executive Premier Workshop
- One-Day Options Course
- OptionsPro
- Retirement Income Workshop
- Sure-Fire Trading Systems (VectorVest, Inc.)
- Trading as a Business Workshop
- VectorVest 7 EOD
- VectorVest 7 RealTime/IntraDay
- VectorVest AutoTester
- VectorVest Educational Services
- VectorVest OnLine
- VectorVest Options Analyzer
- VectorVest ProGraphics v6.0
- VectorVest ProTrader 7
- VectorVest RealTime Derby Tool
- VectorVest Simulator
- VectorVest Variator
- VectorVest Watchdog
