HOT TOPICS LIST
- MACD
- Fibonacci
- RSI
- Gann
- ADXR
- Stochastics
- Volume
- Triangles
- Futures
- Cycles
- Volatility
- ZIGZAG
- MESA
- Retracement
- Aroon
INDICATORS LIST
LIST OF TOPICS
PRINT THIS ARTICLE
by Austin Passamonte
Here's the short-term to near-term outlook for heating oil futures.
Position: N/A
Austin Passamonte
Austin is a private trader who trades emini stock index futures intraday. He currently trades various futures markets from home in addition to managing a trader's educational forum
PRINT THIS ARTICLE
TECHNICAL ANALYSIS
Heating Up
10/19/09 09:53:09 AMby Austin Passamonte
Here's the short-term to near-term outlook for heating oil futures.
Position: N/A
| We've entered what is usually a bullish fundamental period for heating oil futures. The Northeast and Midwest portions of the US rely heavily on fuel oil to heat homes and commercial buildings through the winter. By far the largest percentage of population lives and works within the colder zones where fuel oil is a necessity next to food, water, and air. |

|
| FIGURE 1: HO, WEEKLY |
| Graphic provided by: TradeStation. |
| |
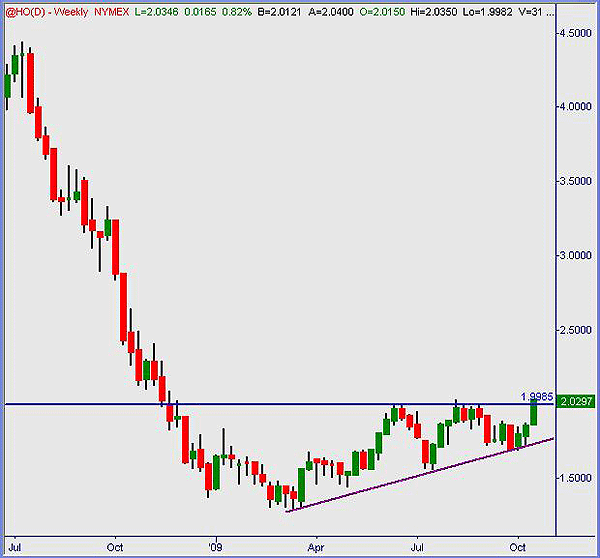
| Last year's colossal collapse came with irrational speculation from hedge funds, which was widely denied at the time and then widely admitted and confirmed after the crash. Meanwhile, the plunge from $4.50 to $1.50 per gallon was a huge relief to consumers (Figure 1). Since then, fuel oil has spent the past several months basing for a potential push higher. Double-top resistance near the $2 level is on a third attempt to press higher now. When it comes to multiple support and resistance tests, third time is usually the charm. |

|
| FIGURE 2: HO, WEEKLY |
| Graphic provided by: TradeStation. |
| |
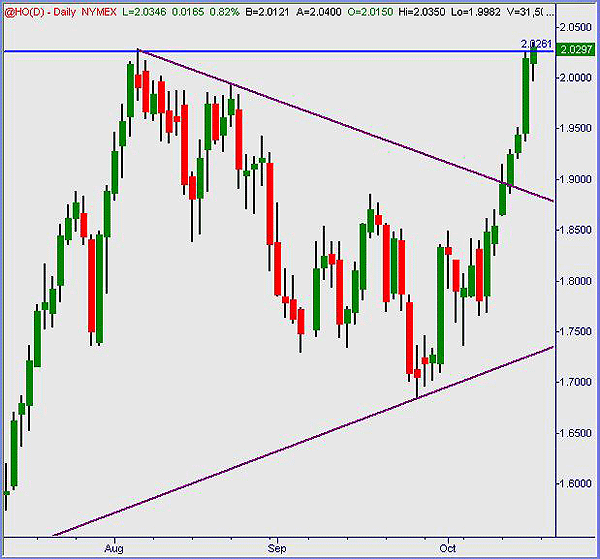
| July through September was one big flag-wedge type of consolidation pattern, upside break staged over the past five sessions at the time of this chart capture. Resistance at the $2 level is visible and notable, but price action holding above 1.90 support should chew through it eventually (Figure 2). A break back inside the visible wedge here negates upside potential should that happen. |

|
| FIGURE 3: HO, DAILY |
| Graphic provided by: TradeStation. |
| |
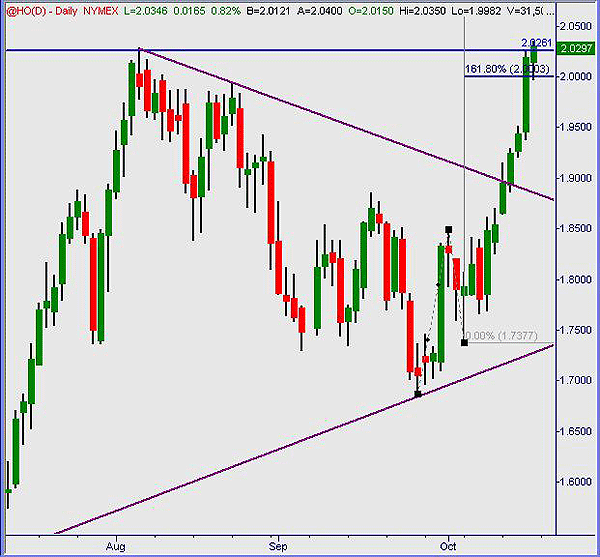
| 1-2-3 projection off the most recent swing higher shows the $2 gallon level as yet another layer of magnetism. Quite possible price hangs out here for awhile, or trades above and back down into it as multiple tests of prior resistance now evolving into support (see Figure 3). |

|
| FIGURE 4: HO, DAILY |
| Graphic provided by: TradeStation. |
| |
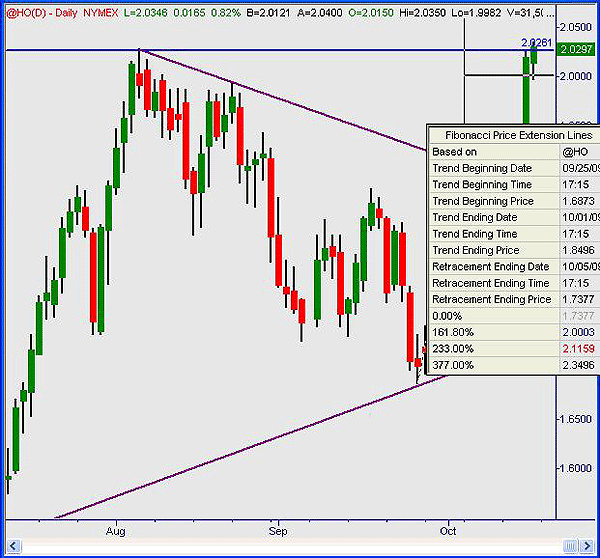
| The same 1-2-3 projection label shows 2.12 and then 2.35 as the next immediate upside price objectives to some. One or both measures are probable soon if price continues its northward march. As frost settles into the northern parts of this country, seasonal pressures are ripe for price to move decidedly from here (see Figure 4). |
Austin is a private trader who trades emini stock index futures intraday. He currently trades various futures markets from home in addition to managing a trader's educational forum
| Title: | Individual Trader |
| Company: | CoiledMarkets.com |
| Address: | PO Box 633 |
| Naples, NY 14512 | |
| Website: | coiledmarkets.com/blog |
| E-mail address: | austinp44@yahoo.com |
Traders' Resource Links | |
| CoiledMarkets.com has not added any product or service information to TRADERS' RESOURCE. | |
Click here for more information about our publications!
Comments
Date: 10/20/09Rank: 3Comment:

Request Information From Our Sponsors
- StockCharts.com, Inc.
- Candle Patterns
- Candlestick Charting Explained
- Intermarket Technical Analysis
- John Murphy on Chart Analysis
- John Murphy's Chart Pattern Recognition
- John Murphy's Market Message
- MurphyExplainsMarketAnalysis-Intermarket Analysis
- MurphyExplainsMarketAnalysis-Visual Analysis
- StockCharts.com
- Technical Analysis of the Financial Markets
- The Visual Investor
- VectorVest, Inc.
- Executive Premier Workshop
- One-Day Options Course
- OptionsPro
- Retirement Income Workshop
- Sure-Fire Trading Systems (VectorVest, Inc.)
- Trading as a Business Workshop
- VectorVest 7 EOD
- VectorVest 7 RealTime/IntraDay
- VectorVest AutoTester
- VectorVest Educational Services
- VectorVest OnLine
- VectorVest Options Analyzer
- VectorVest ProGraphics v6.0
- VectorVest ProTrader 7
- VectorVest RealTime Derby Tool
- VectorVest Simulator
- VectorVest Variator
- VectorVest Watchdog
