HOT TOPICS LIST
- MACD
- Fibonacci
- RSI
- Gann
- ADXR
- Stochastics
- Volume
- Triangles
- Futures
- Cycles
- Volatility
- ZIGZAG
- MESA
- Retracement
- Aroon
INDICATORS LIST
LIST OF TOPICS
PRINT THIS ARTICLE
by Mike Carr, CMT
Combining volume with momentum is a tool used to spot trend changes in stocks that can be applied to futures markets as well.
Position: N/A
Mike Carr, CMT
Mike Carr, CMT, is a member of the Market Technicians Association, and editor of the MTA's newsletter, Technically Speaking. He is also the author of "Smarter Investing in Any Economy: The Definitive Guide to Relative Strength Investing," and "Conquering the Divide: How to Use Economic Indicators to Catch Stock Market Trends."
PRINT THIS ARTICLE
MACD
Looking At Futures With Volume-Weighted MACD Histogram
10/19/09 09:39:48 AMby Mike Carr, CMT
Combining volume with momentum is a tool used to spot trend changes in stocks that can be applied to futures markets as well.
Position: N/A
| The October 2009 Technical Analysis of STOCKS & COMMODITIES contains an article called "Volume-Weighted MACD Histogram" in which David Hawkins shows how he uses a volume-weighted moving average to calculate moving average convergence/divergence (MACD). This technique was first used by Buff Dormeier, CMT, and has been written about since at least 2002. However, few traders use this idea in their trading. |
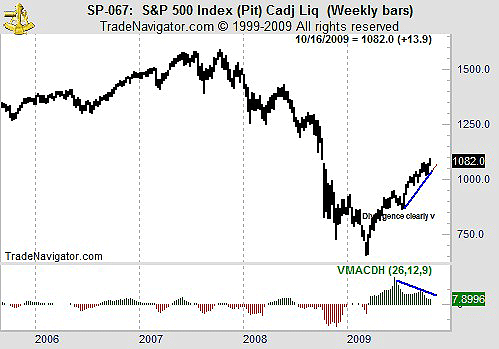
| Looking at the futures contract for the Standard & Poor's 500, we see that the VWMACD may be running out of steam. Of course, a single indicator should never be relied on for a trading decision, but this one is flashing a cautionary signal. The emini contract shows the same trend. See Figure 1. |

|
| FIGURE 1: S&P 500, WEEKLY. The divergence between price and the VWMACD shows that prices may be nearing an end of the uptrend. |
| Graphic provided by: Trade Navigator. |
| |
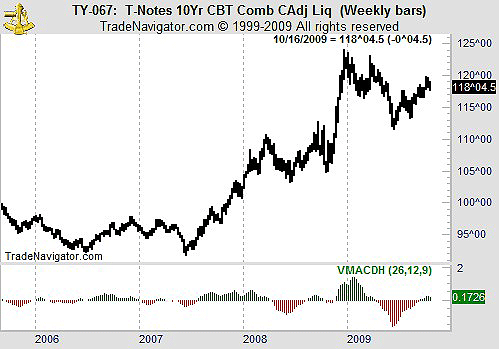
| The 10-year US Treasury contract (Figure 2) may also be showing that trouble lies ahead for stock market bulls. The VWMACD has turned bullish, which would mean higher interest rates. In general, traders assume higher interest rates are a negative for stocks. |

|
| FIGURE 2: 10-YEAR TREASURY NOTE, WEEKLY. The 10-year Treasury note may be at the beginning of a bullish move. |
| Graphic provided by: Trade Navigator. |
| |
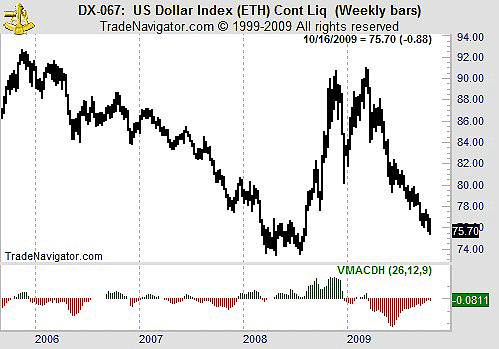
| The dollar contract is still in a bearish trend using the VWMACD, although it is nearing the zero line. A move above zero would be bullish for the dollar and potentially reverse the 31 weeks of negative readings of this indicator. |

|
| FIGURE 3: US DOLLAR INDEX, WEEKLY. The dollar may also be at the beginning of a bullish move, although confirmation is needed. |
| Graphic provided by: Trade Navigator. |
| |
| VWMACD offers potentially useful signals in futures markets and should be considered by traders looking for an edge in the markets. In particular, it is useful to look at a chart with MACD and note divergences. These may indicate that large traders are actively trading a contract. |
Mike Carr, CMT, is a member of the Market Technicians Association, and editor of the MTA's newsletter, Technically Speaking. He is also the author of "Smarter Investing in Any Economy: The Definitive Guide to Relative Strength Investing," and "Conquering the Divide: How to Use Economic Indicators to Catch Stock Market Trends."
| Website: | www.moneynews.com/blogs/MichaelCarr/id-73 |
| E-mail address: | marketstrategist@gmail.com |
Click here for more information about our publications!
Comments
Date: 10/20/09Rank: 5Comment:
Date: 10/23/09Rank: 3Comment:

Request Information From Our Sponsors
- VectorVest, Inc.
- Executive Premier Workshop
- One-Day Options Course
- OptionsPro
- Retirement Income Workshop
- Sure-Fire Trading Systems (VectorVest, Inc.)
- Trading as a Business Workshop
- VectorVest 7 EOD
- VectorVest 7 RealTime/IntraDay
- VectorVest AutoTester
- VectorVest Educational Services
- VectorVest OnLine
- VectorVest Options Analyzer
- VectorVest ProGraphics v6.0
- VectorVest ProTrader 7
- VectorVest RealTime Derby Tool
- VectorVest Simulator
- VectorVest Variator
- VectorVest Watchdog
- StockCharts.com, Inc.
- Candle Patterns
- Candlestick Charting Explained
- Intermarket Technical Analysis
- John Murphy on Chart Analysis
- John Murphy's Chart Pattern Recognition
- John Murphy's Market Message
- MurphyExplainsMarketAnalysis-Intermarket Analysis
- MurphyExplainsMarketAnalysis-Visual Analysis
- StockCharts.com
- Technical Analysis of the Financial Markets
- The Visual Investor
