

HOT TOPICS LIST
- MACD
- Fibonacci
- RSI
- Gann
- ADXR
- Stochastics
- Volume
- Triangles
- Futures
- Cycles
- Volatility
- ZIGZAG
- MESA
- Retracement
- Aroon
INDICATORS LIST
LIST OF TOPICS
PRINT THIS ARTICLE
by Donald W. Pendergast, Jr.
It's been a long, slow grind higher for USO, but the recent weekly breakout looks to be very convincing.
Position: N/A
Donald W. Pendergast, Jr.
Donald W. Pendergast is a financial markets consultant who offers specialized services to stock brokers and high net worth individuals who seek a better bottom line for their portfolios.
PRINT THIS ARTICLE
AROON
Convincing Break Higher With USO
10/19/09 09:31:31 AMby Donald W. Pendergast, Jr.
It's been a long, slow grind higher for USO, but the recent weekly breakout looks to be very convincing.
Position: N/A
| Crude oil has made a convincing turnaround since it bottomed last March, and recent technical action suggests that more gains may be due before the current rally in this energy commodity finally levels off. |
|
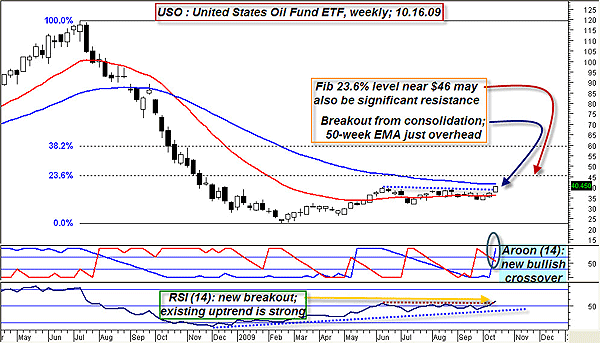
| FIGURE 1: USO, WEEKLY. The recent weekly breakout from consolidation is confirmed by the strong Aroon(14) and RSI(14) readings. The 50-week EMA near $41.50 may be a resistance area. |
| Graphic provided by: MetaStock. |
| |
| Figure 1 is the weekly chart of USO, the US Oil Fund exchange traded fund (ETF). USO has just broken higher from a significant multimonth consolidation pattern, and the associated technicals appear to support the validity of this move higher. The Aroon (14) trend intensity indicator has just swung all the way to the extreme bullish end of its range (the blue line crossing the red line) even as the relative strength index (RSI)(14) has also completed a successful breakout. In addition, the uptrend line in the RSI (14) looks very solid and it is reading is 57.42 and rising. This is a trend that shouldn't be easily dismissed, and enterprising traders will likely start to look for daily based pullbacks to meaningful support in order to initiate new long positions. USO may find some resistance near $41.34, which is the current location of its 50-week exponential moving average (EMA), which may cause a minor pullback on the daily time frame, so traders should monitor USO carefully near that price level. Beyond that lies the Fibonacci 23.6% retracement level near $45.90; this should also be a major resistance area. It's hard to believe that USO still hasn't even retraced a quarter of last year's decline yet, but there it is. |
|
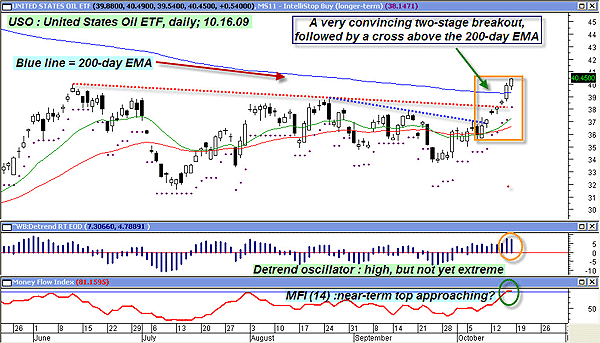
| FIGURE 2: USO, DAILY. An upclose view of the breakout on a daily chart; the two-stage breakout followed by a daily close above the 200-day EMA puts this energy ETF squarely back into bull territory. |
| Graphic provided by: MetaStock. |
| Graphic provided by: WB Detrend RT EOD from ProfitTrader. |
| |
| Moving over to USO's daily chart (Figure 2), we find additional technical clues that suggest that while this ETF may still have more room to run over the long term, for right now, the technicals suggest that USO may be getting ahead of itself. First off, however, note the two-stage breakout (above the red and blue trendlines), followed by a strong thrust above the 200-day EMA. This is a very powerful breakout pattern, and even the detrend oscillator isn't really overextended yet, compared to prior historical readings. At the very bottom of the chart, the money flow indicator (MFI)(14) is getting into overbought territory, but remember, as with most oscillators, the MFI can and will give premature overbought/oversold signals, especially when a strong trend (up or down) is in progress. Nonetheless, it's likely not a good idea to go long USO right now; as stated before, it would be far wiser to wait for a proportional pullback against the uptrend before initiating new long positions. |
| With crude oil (USO) and precious metals (gold and silver) coming on so strong lately, it does make us wonder what percentage of these gains have been the result of hyperinflating the money supply in the US and other Western nations. We as traders can't determine monetary policy, but at least we can try to stay on the right side of the inflationary curve by seeking to time opportune long entries into the commodities and commodity ETFs that are likely to return gains far greater than the rate of inflation. The art of technical analysis can and will serve us well as we seek to profit from the forces of inflation rather than to be victimized by them. |
Donald W. Pendergast is a financial markets consultant who offers specialized services to stock brokers and high net worth individuals who seek a better bottom line for their portfolios.
| Title: | Writer, market consultant |
| Company: | Linear Trading Systems LLC |
| Jacksonville, FL 32217 | |
| Phone # for sales: | 904-239-9564 |
| E-mail address: | lineartradingsys@gmail.com |
Traders' Resource Links | |
| Linear Trading Systems LLC has not added any product or service information to TRADERS' RESOURCE. | |
Click here for more information about our publications!
Comments
Date:�10/20/09Rank:�5Comment:�

Request Information From Our Sponsors
- StockCharts.com, Inc.
- Candle Patterns
- Candlestick Charting Explained
- Intermarket Technical Analysis
- John Murphy on Chart Analysis
- John Murphy's Chart Pattern Recognition
- John Murphy's Market Message
- MurphyExplainsMarketAnalysis-Intermarket Analysis
- MurphyExplainsMarketAnalysis-Visual Analysis
- StockCharts.com
- Technical Analysis of the Financial Markets
- The Visual Investor
- VectorVest, Inc.
- Executive Premier Workshop
- One-Day Options Course
- OptionsPro
- Retirement Income Workshop
- Sure-Fire Trading Systems (VectorVest, Inc.)
- Trading as a Business Workshop
- VectorVest 7 EOD
- VectorVest 7 RealTime/IntraDay
- VectorVest AutoTester
- VectorVest Educational Services
- VectorVest OnLine
- VectorVest Options Analyzer
- VectorVest ProGraphics v6.0
- VectorVest ProTrader 7
- VectorVest RealTime Derby Tool
- VectorVest Simulator
- VectorVest Variator
- VectorVest Watchdog