HOT TOPICS LIST
- MACD
- Fibonacci
- RSI
- Gann
- ADXR
- Stochastics
- Volume
- Triangles
- Futures
- Cycles
- Volatility
- ZIGZAG
- MESA
- Retracement
- Aroon
INDICATORS LIST
LIST OF TOPICS
PRINT THIS ARTICLE
by Chaitali Mohile
Liberty Global has reached an important zone. A stable bullish breakout would be an attractive buying opportunity.
Position: Buy
Chaitali Mohile
Active trader in the Indian stock markets since 2003 and a full-time writer. Trading is largely based upon technical analysis.
PRINT THIS ARTICLE
BREAKOUTS
Liberty Global Likely To Break Out
10/16/09 11:19:02 AMby Chaitali Mohile
Liberty Global has reached an important zone. A stable bullish breakout would be an attractive buying opportunity.
Position: Buy
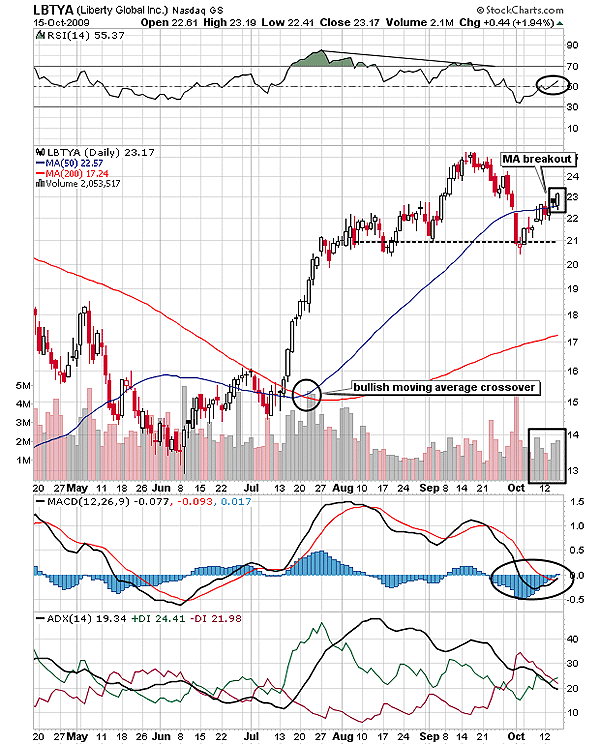
| When a short-term moving average (MA) crosses a long-term MA going up, the MA undergoes a bullish crossover. The bullish crossover is one of the strong buying signals on the technical chart. In Figure 1, Liberty Global Inc. (LBTYA) breached the 50-day MA and the 200-day MA resistances with encouraging volume, offering the first bullish indication on the price chart. After the price breakout, the 50-day MA surged above the 200-day MA, reflecting the bullish crossover. Thereafter, the 50-day MA continued moving higher with greater strength. The two breakouts brightened the bullish sentiments and rapidly went up by $6. Both breakouts generated a strong buying opportunity for buyers eagerly waiting to board the train. The sharp vertical rally consolidated near $21. |

|
| FIGURE 1: LBTYA, DAILY |
| Graphic provided by: StockCharts.com. |
| |
| During consolidation, the relative strength index (RSI) (14) reached its overbought levels and started declining. Since the price formed higher highs, a negative divergence was visible in Figure 1. However, LBTYA retraced to the immediate support line at 21 levels with a drop of $4. Another reason for the drop in price was the declining average directional movement index (ADX) (14) from overheated uptrend levels. In Figure 2, the ADX (14) descended after hitting an overheated level at 40. Due to the drop in price levels, the increased selling pressure tried to capture the trend. But the support at 21 levels changed the bearish path of the RSI (14) as well as the ADX (14). The moving average convergence/divergence (MACD) (12,26,9) turned upward, indicating the possibility of a bullish crossover in negative territory. |
| Hence, LBTYA successfully moved upward and once again established support at the 50-day MA. At this breakout point, the short-term traders would get a low-risk buying place. The RSI (14) has breached the center line, reconfirming the buying opportunity in Figure 1. |

|
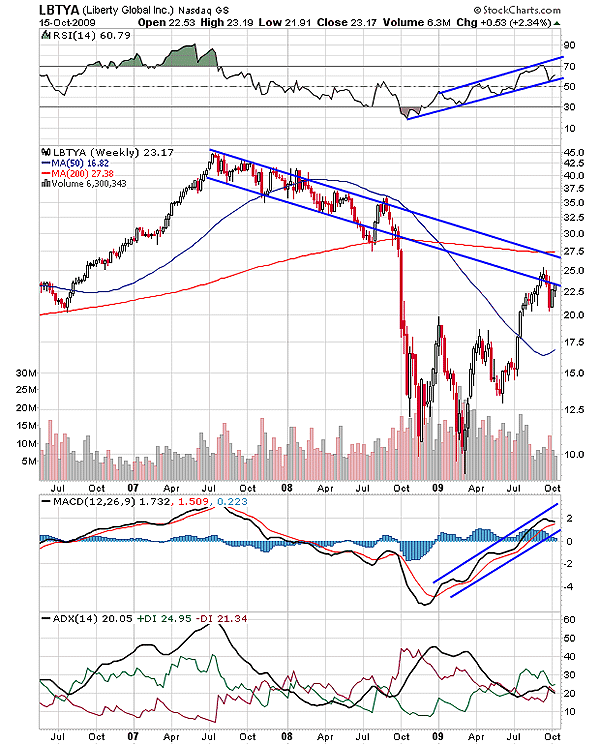
| FIGURE 2: LBTYA, WEEKLY |
| Graphic provided by: StockCharts.com. |
| |
| Let us get more of an additional confirmation from the weekly time frame for short-term trading. After extending the previous descending channel's trendlines, we get the trading range for the current rally. The bullish rally of LBTYA has reached the lower trendline of the channel and is likely to establish support there. The ascending RSI (14) has slipped into the bullish zone above 50 levels, the MACD (12,26,9) is equally bullish and has steadily moved in positive territory. The ADX (14) is indicating a developing uptrend. On these bullish notes, the stock would convert the lower trendline resistance to support and rally within the channel. |
| Thus, traders can trigger fresh long positions at this breakout level as per a daily as well as a weekly time frame. |
Active trader in the Indian stock markets since 2003 and a full-time writer. Trading is largely based upon technical analysis.
| Company: | Independent |
| Address: | C1/3 Parth Indraprasth Towers. Vastrapur |
| Ahmedabad, Guj 380015 | |
| E-mail address: | chaitalimohile@yahoo.co.in |
Traders' Resource Links | |
| Independent has not added any product or service information to TRADERS' RESOURCE. | |
Click here for more information about our publications!
Comments

Request Information From Our Sponsors
- StockCharts.com, Inc.
- Candle Patterns
- Candlestick Charting Explained
- Intermarket Technical Analysis
- John Murphy on Chart Analysis
- John Murphy's Chart Pattern Recognition
- John Murphy's Market Message
- MurphyExplainsMarketAnalysis-Intermarket Analysis
- MurphyExplainsMarketAnalysis-Visual Analysis
- StockCharts.com
- Technical Analysis of the Financial Markets
- The Visual Investor
- VectorVest, Inc.
- Executive Premier Workshop
- One-Day Options Course
- OptionsPro
- Retirement Income Workshop
- Sure-Fire Trading Systems (VectorVest, Inc.)
- Trading as a Business Workshop
- VectorVest 7 EOD
- VectorVest 7 RealTime/IntraDay
- VectorVest AutoTester
- VectorVest Educational Services
- VectorVest OnLine
- VectorVest Options Analyzer
- VectorVest ProGraphics v6.0
- VectorVest ProTrader 7
- VectorVest RealTime Derby Tool
- VectorVest Simulator
- VectorVest Variator
- VectorVest Watchdog
