HOT TOPICS LIST
- MACD
- Fibonacci
- RSI
- Gann
- ADXR
- Stochastics
- Volume
- Triangles
- Futures
- Cycles
- Volatility
- ZIGZAG
- MESA
- Retracement
- Aroon
INDICATORS LIST
LIST OF TOPICS
PRINT THIS ARTICLE
by Donald W. Pendergast, Jr.
The basic materials sector has rebounded strongly since March 2009. Here's a key player from that sector that just signaled a fresh buying opportunity for daily traders.
Position: Buy
Donald W. Pendergast, Jr.
Donald W. Pendergast is a financial markets consultant who offers specialized services to stock brokers and high net worth individuals who seek a better bottom line for their portfolios.
PRINT THIS ARTICLE
SUPPORT & RESISTANCE
Vulcan Materials Break Higher After Support Test
10/16/09 09:11:36 AMby Donald W. Pendergast, Jr.
The basic materials sector has rebounded strongly since March 2009. Here's a key player from that sector that just signaled a fresh buying opportunity for daily traders.
Position: Buy
| Birmingham, AL–Vulcan Materials Co. (VMC) is a leading producer of construction aggregates such as cement, gravel, crushed stone, and sand. The stock has been grinding steadily higher for the past seven months and has just confirmed a new buy signal for daily traders. Let's have a closer look at this setup now. |

|
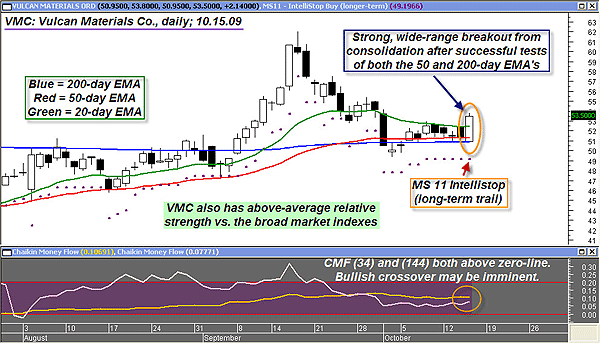
| FIGURE 1: VMC, DAILY. With a fresh 4x9 EMA crossover and a bullish breakout from a consolidation pattern after a test/retest of key EMA supports, this daily long trade setup appears to be relatively low-risk. |
| Graphic provided by: MetaStock. |
| |
| Traders who focus on breakout entries know that the best trades frequently occur after the stock or commodity in question has successfully completed a test of a prior support or resistance level. Once they've located a strong breakout that has already completed such a test, they have much more confidence in deploying capital into such a breakout setup. That appears to be the case in Figure 1 in shares of VMC; after declining from September's high of $62, the stock tested and then retested both its 50-day exponential moving average (EMA) (the red line on the chart) and 200-day exponential moving average (the blue line on the chart) and has now broken significantly higher from a narrow-range consolidation in the wake of such major EMA support tests. Even better, the stock has plowed right through its 20-day EMA as well, fully positioning the stock back into major bull-market territory. Further strengthening the bullish case for VMC is the current short-term and long-term money flow configuration in the stock. Both of the Chaikin money flow measures (don't trade without including this essential technical tool), the (CMF)(34) and (CMF)(144), are above their respective zero lines, with the shorter-term money flow line also appearing as if it may be ready to make a bullish crossover above the longer-term indicator line. Another kicker here is that the four-day EMA has just crossed the nine-day EMA and prices are also above the 18-day EMA; this is based on a modified (faster) version of RC Allen's famous 4-9-18 EMA crossover system, the one he first published in 1972. It's a great system on its own, but with all of the other technicals already discussed added to it, this looks like a very solid trade, one with a good risk-to reward ratio. |
| Trade management couldn't be any easier; after entering at the next session's open (or putting half on at the open and waiting for a possible intraday pullback to add the other half), conservative traders might want to use Thursday's daily low as their initial stop ($50.90) or maybe even set a stop a few ticks beneath the 200-day EMA (at about $50.83). Then, as the trailing stop rises (if the trade follows through as intended), you could always use that for the balance of the trade. Since there is significant chart resistance (a prior swing high) near $57.49, taking some partial profits near that price (if it gets that far) might be an excellent way to guard against a possible broad market reversal, letting the rest of the position run with either the MS 11 Intellistop (long-term buy) or even a simple three-bar trailing stop of the lows. |
| Checking for a valid test/retest of key support/resistance levels is one of the first things that successful breakout traders do before considering any breakout trade setup. You should do this too, and without fail; if you do so, your trading results should become noticeably better with fewer early stop-out and fake-out moves. |
Donald W. Pendergast is a financial markets consultant who offers specialized services to stock brokers and high net worth individuals who seek a better bottom line for their portfolios.
| Title: | Writer, market consultant |
| Company: | Linear Trading Systems LLC |
| Jacksonville, FL 32217 | |
| Phone # for sales: | 904-239-9564 |
| E-mail address: | lineartradingsys@gmail.com |
Traders' Resource Links | |
| Linear Trading Systems LLC has not added any product or service information to TRADERS' RESOURCE. | |
Click here for more information about our publications!
Comments
Date: 10/18/09Rank: 3Comment:

Request Information From Our Sponsors
- StockCharts.com, Inc.
- Candle Patterns
- Candlestick Charting Explained
- Intermarket Technical Analysis
- John Murphy on Chart Analysis
- John Murphy's Chart Pattern Recognition
- John Murphy's Market Message
- MurphyExplainsMarketAnalysis-Intermarket Analysis
- MurphyExplainsMarketAnalysis-Visual Analysis
- StockCharts.com
- Technical Analysis of the Financial Markets
- The Visual Investor
- VectorVest, Inc.
- Executive Premier Workshop
- One-Day Options Course
- OptionsPro
- Retirement Income Workshop
- Sure-Fire Trading Systems (VectorVest, Inc.)
- Trading as a Business Workshop
- VectorVest 7 EOD
- VectorVest 7 RealTime/IntraDay
- VectorVest AutoTester
- VectorVest Educational Services
- VectorVest OnLine
- VectorVest Options Analyzer
- VectorVest ProGraphics v6.0
- VectorVest ProTrader 7
- VectorVest RealTime Derby Tool
- VectorVest Simulator
- VectorVest Variator
- VectorVest Watchdog
