HOT TOPICS LIST
- MACD
- Fibonacci
- RSI
- Gann
- ADXR
- Stochastics
- Volume
- Triangles
- Futures
- Cycles
- Volatility
- ZIGZAG
- MESA
- Retracement
- Aroon
INDICATORS LIST
LIST OF TOPICS
PRINT THIS ARTICLE
by Koos van der Merwe
On CNBC some time ago, Suze Orman advised investors to invest in ETFs for the dividend. "Buy them, enjoy the dividend, and don't watch them," she said.
Position: Buy
Koos van der Merwe
Has been a technical analyst since 1969, and has worked as a futures and options trader with First Financial Futures in Johannesburg, South Africa.
PRINT THIS ARTICLE
HEAD & SHOULDERS
Going For ETFs
10/16/09 08:30:11 AMby Koos van der Merwe
On CNBC some time ago, Suze Orman advised investors to invest in ETFs for the dividend. "Buy them, enjoy the dividend, and don't watch them," she said.
Position: Buy
| At that time, had you bought exchange traded funds (ETFs), you would have watched with anxiety as they collapsed along with the market, but her advice — not to watch them but enjoy the dividend — was worth it. Many of them have returned to the price the ETF was when she gave her investment advice. So what is an exchange traded fund? An ETF is an investment vehicle traded on stock exchanges, much like stocks. It will hold assets such as stocks or bonds and trades at approximately the same price as the net asset value of its underlying assets over the course of the trading day. Most ETFs track an index, such as the Standard & Poor's 500 or MSCI EAFE and may be attractive as an investment because of their low costs, tax efficiency, and stocklike features. Many pay an attractive dividend either monthly or quarterly. Dividend ETFs combine the benefits of dividend investing with a low cost and diversification. They have been a hit with income-seeking investors, especially after the meltdown of 2008. When markets are falling, a dividend return becomes an important part of the investor's return. By investing in a dividend-paying ETF, you receive a broad exposure to dividend-paying stocks without the single-stock risk. |
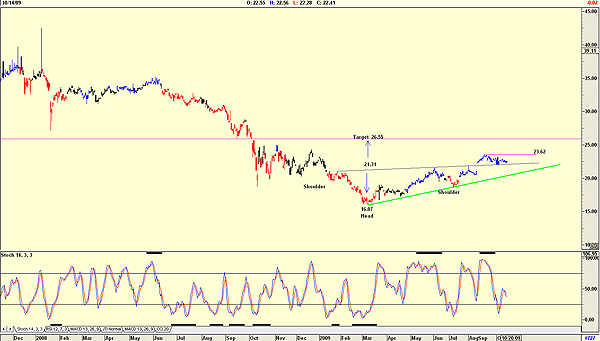
| The two ETFs that pay the best yield as of this writing are both listed on the Toronto Stock Exchange. They are the iShares Canadian S&P/TSX Income Trust Index Fund (XTR-T) with a yield of 9.20% and the iShares Canadian S&P/TSX CPPD REIT Index (XRE-T) with a yield of 7.81%. In the US, the best-yielding ETF is iShares IBOXX $ INVTOP InvestGrade Corp (LQD-US) with a yield of 5.891% followed by Wisdom Tree Intl Utilities (DBU-US) with a yield of 5.620%. Of course, these yields will change with the movement in the market — if the share price falls, the yields go up, so you should buy on the dips to obtain the highest yield. The chart I have chosen to watch is the Wisdom Tree International Utilities simply because it looks interesting (Figure 1). You should always keep in mind that the higher the dividend, the more investors the share will attract, so there is a good chance of a capital gain that is greater than the dividend paid. |

|
| FIGURE 1: WISDOM TREE INTERNATIONAL UTILITIES, DAILY |
| Graphic provided by: AdvancedGET. |
| |
| The chart shows the following: 1. An inverse head & shoulders pattern with a target of $26.55. 2. The price has broken above the neckline and retraced to find support on it. 3. The stochastic indicator shown has given a buy signal. 4. The chart shows a resistance at $23.62, and a move above this level is a definite buy. To conclude, with a dividend yield of 5.62% and a chart that looks as though the price should increase, whether it does or not, the ETF is very much a buy at present levels. |
Has been a technical analyst since 1969, and has worked as a futures and options trader with First Financial Futures in Johannesburg, South Africa.
| Address: | 3256 West 24th Ave |
| Vancouver, BC | |
| Phone # for sales: | 6042634214 |
| E-mail address: | petroosp@gmail.com |
Click here for more information about our publications!
Comments
Date: 10/18/09Rank: 3Comment:

Request Information From Our Sponsors
- StockCharts.com, Inc.
- Candle Patterns
- Candlestick Charting Explained
- Intermarket Technical Analysis
- John Murphy on Chart Analysis
- John Murphy's Chart Pattern Recognition
- John Murphy's Market Message
- MurphyExplainsMarketAnalysis-Intermarket Analysis
- MurphyExplainsMarketAnalysis-Visual Analysis
- StockCharts.com
- Technical Analysis of the Financial Markets
- The Visual Investor
- VectorVest, Inc.
- Executive Premier Workshop
- One-Day Options Course
- OptionsPro
- Retirement Income Workshop
- Sure-Fire Trading Systems (VectorVest, Inc.)
- Trading as a Business Workshop
- VectorVest 7 EOD
- VectorVest 7 RealTime/IntraDay
- VectorVest AutoTester
- VectorVest Educational Services
- VectorVest OnLine
- VectorVest Options Analyzer
- VectorVest ProGraphics v6.0
- VectorVest ProTrader 7
- VectorVest RealTime Derby Tool
- VectorVest Simulator
- VectorVest Variator
- VectorVest Watchdog
