HOT TOPICS LIST
- MACD
- Fibonacci
- RSI
- Gann
- ADXR
- Stochastics
- Volume
- Triangles
- Futures
- Cycles
- Volatility
- ZIGZAG
- MESA
- Retracement
- Aroon
INDICATORS LIST
LIST OF TOPICS
PRINT THIS ARTICLE
by Mike Carr, CMT
Technical analysis often identifies trades weeks before significant news events.
Position: N/A
Mike Carr, CMT
Mike Carr, CMT, is a member of the Market Technicians Association, and editor of the MTA's newsletter, Technically Speaking. He is also the author of "Smarter Investing in Any Economy: The Definitive Guide to Relative Strength Investing," and "Conquering the Divide: How to Use Economic Indicators to Catch Stock Market Trends."
PRINT THIS ARTICLE
STRATEGIES
Today's Technicals Write Tomorrow's Headlines
10/16/09 08:19:55 AMby Mike Carr, CMT
Technical analysis often identifies trades weeks before significant news events.
Position: N/A
| Well-known market technician Andrew Cardwell is fond of saying that technical analysis writes tomorrow's news stories. In the case of the US dollar, recent news provided a fundamental reason for the selloff that took place over the past few months. |
| Bloomberg News reported on a trend that central banks were shifting away from the US dollar. The story stated that policy makers boosted foreign currency holdings by $413 billion last quarter, the most since at least 2003, to $7.3 trillion, going on to say that nations reporting currency breakdowns put 63% of the new cash into euros and yen in April, May, and June, according to the latest Barclays Capital data. That is the highest percentage in any quarter with more than an $80 billion increase. |
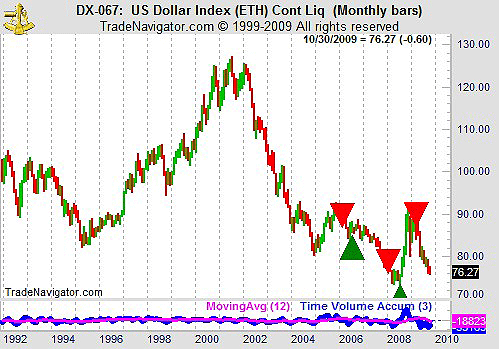
| Technicians could have spotted this action much earlier than the October dateline on the story. Figure 1 shows a monthly chart of the futures contract on the US Dollar Index with the time volume accumulation indicator (TVA). Futures contracts offer one of the few insights into information about volume on foreign exchange markets.The TVA assigns only that part of the volume that drove the price change to the indicator, ignoring the rest of the activity as market noise. The formula for TVA is: MovingAvg (Volume * (Close - Close.1) / (True High - True Low), NumBars) For this analysis, we took a three-month moving average of TVA to smooth out the quarterly fluctuations. A 12-month moving average provides tiny signals. We can see that TVA dropped below its moving average and gave a strong sell signal at the end of March just as central banks began shifting from dollars to other currencies. |

|
| FIGURE 1: US DOLLAR, MONTHLY. TVA offers infrequent but significant timing signals on the dollar index. |
| Graphic provided by: Trade Navigator. |
| |
| Most of the time, volume tells us very little. But occasionally, a truly valuable signal is offered. To spot these, traders can add 5% bands to the moving average. This will provide a way to spot the big moves. These signals are highlighted in the chart. Forex traders can use that as a starting point for analyzing the best pair to trade. |
Mike Carr, CMT, is a member of the Market Technicians Association, and editor of the MTA's newsletter, Technically Speaking. He is also the author of "Smarter Investing in Any Economy: The Definitive Guide to Relative Strength Investing," and "Conquering the Divide: How to Use Economic Indicators to Catch Stock Market Trends."
| Website: | www.moneynews.com/blogs/MichaelCarr/id-73 |
| E-mail address: | marketstrategist@gmail.com |
Click here for more information about our publications!
Comments
Date: 10/18/09Rank: 4Comment:

|

Request Information From Our Sponsors
- VectorVest, Inc.
- Executive Premier Workshop
- One-Day Options Course
- OptionsPro
- Retirement Income Workshop
- Sure-Fire Trading Systems (VectorVest, Inc.)
- Trading as a Business Workshop
- VectorVest 7 EOD
- VectorVest 7 RealTime/IntraDay
- VectorVest AutoTester
- VectorVest Educational Services
- VectorVest OnLine
- VectorVest Options Analyzer
- VectorVest ProGraphics v6.0
- VectorVest ProTrader 7
- VectorVest RealTime Derby Tool
- VectorVest Simulator
- VectorVest Variator
- VectorVest Watchdog
- StockCharts.com, Inc.
- Candle Patterns
- Candlestick Charting Explained
- Intermarket Technical Analysis
- John Murphy on Chart Analysis
- John Murphy's Chart Pattern Recognition
- John Murphy's Market Message
- MurphyExplainsMarketAnalysis-Intermarket Analysis
- MurphyExplainsMarketAnalysis-Visual Analysis
- StockCharts.com
- Technical Analysis of the Financial Markets
- The Visual Investor
