HOT TOPICS LIST
- MACD
- Fibonacci
- RSI
- Gann
- ADXR
- Stochastics
- Volume
- Triangles
- Futures
- Cycles
- Volatility
- ZIGZAG
- MESA
- Retracement
- Aroon
INDICATORS LIST
LIST OF TOPICS
PRINT THIS ARTICLE
by Donald W. Pendergast, Jr.
Deere & Co. has just flashed a short-term buy signal, even as a major wedge pattern appears to be close to resolution.
Position: Accumulate
Donald W. Pendergast, Jr.
Donald W. Pendergast is a financial markets consultant who offers specialized services to stock brokers and high net worth individuals who seek a better bottom line for their portfolios.
PRINT THIS ARTICLE
WEDGE FORMATIONS
With DE, Daily Buy Signal Within Large Weekly Wedge
10/15/09 09:20:12 AMby Donald W. Pendergast, Jr.
Deere & Co. has just flashed a short-term buy signal, even as a major wedge pattern appears to be close to resolution.
Position: Accumulate
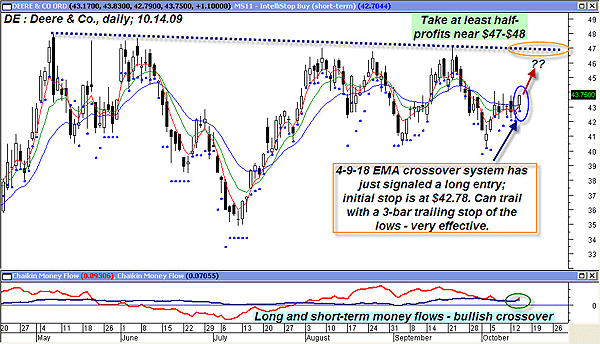
| Deere & Co. (DE) has been on a wild ride over the past 18 months, falling from the low $90s in April 2008 all the way down to the mid-$20s in March 2009. Like the rest of the broad market, its shares have staged a fairly decent rebound since the March 2009 lows, but they have been repeatedly turned back every time (six times in all) they approach the $47–48 price area. Let's take a closer look at the technicals on DE's daily chart (Figure 1). |

|
| FIGURE 1: DE, DAILY. This trade appears to have excellent risk-reward dynamics, especially when trailed with a two- to three-bar trailing stop of the lows. Should the opportunity present itself, taking some profits near $47 would also be a very wise thing to do. |
| Graphic provided by: MetaStock. |
| |
| One of the most striking features on the daily chart is the number of times that the $47–48 area (dotted line) has acted as very strong resistance. It's held DE back on six consecutive attempts to enter into/above that price zone. Currently, DE has just completed a 4-9-18 exponential moving average (EMA) bullish crossover with a wide-range daily candle and may be setting up for another test of the $47 area; in addition, the long- and short-term Chaikin money flows (CMF)(34) and (CMF)(144) are both above their zero lines, with the short-term money flow line having just made a bullish cross of the long-term line. Managing this position is straightforward; trail it with a three-bar trailing stop of the lows, and if price does manage to get near $47 again, consider grabbing at least half your open profits before that strong overhead resistance line gives you a whack on your greedy little knuckles, potentially taking away much of your hard-earned profits. If you do take half profits on a decent move, at least you have that trailing stop backing up the other half of your position, giving you extra confidence to ride out whatever happens to the price of DE shares. |

|
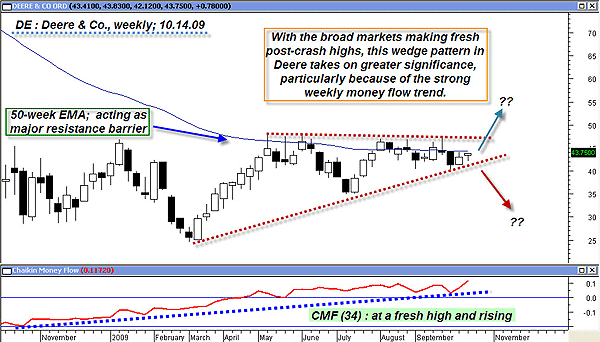
| FIGURE 2: DE, WEEKLY. Trading pattern breakouts can be tough, but the long side needs to be favored here because of the mammoth money flows and also because of the continued strength in the broad markets. |
| Graphic provided by: MetaStock. |
| |
| Now, a look at the weekly chart (Figure 2); it's the same wedge pattern, only compressed due to the higher time frame. Note how the 50-week EMA has been acting as fairly strong resistance for the past few months; a wide-range close above this EMA would be especially bullish, particularly because of the super-strong weekly money flow trend in DE. And, just as on the daily chart, the $47–48 area is the line in the sand on the upside. If DE makes a convincing break above that resistance, it may have some room to fly, as the next major chart resistance doesn't appear until about $64–65. If the stock breaks down from the wedge, $34.90 is the strongest area of support the stock will encounter, followed by strong weekly support near $25. |
| So, while daily traders have a decent swing-style trade going in shares of Deere, longer-term traders might even consider going the buy-write (covered call) route, especially if DE blasts through the upper weekly resistance at $48 with a wide-range candle on heavy volume. If you see that confirmed breakout, start checking the bid-ask spreads, deltas, and implied volatilities of various call options that you can sell against your DE shares. Take your time and run several risk analysis profiles in your option trading software to see what combination of shares and strikes would offer you the best return with the lowest risk. As always, size your positions wisely and don't bet the farm on any single technician's take on the market. Remember, "in a multitude of counselors there is safety." |
Donald W. Pendergast is a financial markets consultant who offers specialized services to stock brokers and high net worth individuals who seek a better bottom line for their portfolios.
| Title: | Writer, market consultant |
| Company: | Linear Trading Systems LLC |
| Jacksonville, FL 32217 | |
| Phone # for sales: | 904-239-9564 |
| E-mail address: | lineartradingsys@gmail.com |
Traders' Resource Links | |
| Linear Trading Systems LLC has not added any product or service information to TRADERS' RESOURCE. | |
Click here for more information about our publications!
Comments
Date: 10/18/09Rank: 5Comment:

Request Information From Our Sponsors
- VectorVest, Inc.
- Executive Premier Workshop
- One-Day Options Course
- OptionsPro
- Retirement Income Workshop
- Sure-Fire Trading Systems (VectorVest, Inc.)
- Trading as a Business Workshop
- VectorVest 7 EOD
- VectorVest 7 RealTime/IntraDay
- VectorVest AutoTester
- VectorVest Educational Services
- VectorVest OnLine
- VectorVest Options Analyzer
- VectorVest ProGraphics v6.0
- VectorVest ProTrader 7
- VectorVest RealTime Derby Tool
- VectorVest Simulator
- VectorVest Variator
- VectorVest Watchdog
- StockCharts.com, Inc.
- Candle Patterns
- Candlestick Charting Explained
- Intermarket Technical Analysis
- John Murphy on Chart Analysis
- John Murphy's Chart Pattern Recognition
- John Murphy's Market Message
- MurphyExplainsMarketAnalysis-Intermarket Analysis
- MurphyExplainsMarketAnalysis-Visual Analysis
- StockCharts.com
- Technical Analysis of the Financial Markets
- The Visual Investor
