HOT TOPICS LIST
- MACD
- Fibonacci
- RSI
- Gann
- ADXR
- Stochastics
- Volume
- Triangles
- Futures
- Cycles
- Volatility
- ZIGZAG
- MESA
- Retracement
- Aroon
INDICATORS LIST
LIST OF TOPICS
PRINT THIS ARTICLE
by David Penn
With the DJU testing post-WTC attack lows, a number of energy stocks are working their way upward.
Position: N/A
David Penn
Technical Writer for Technical Analysis of STOCKS & COMMODITIES magazine, Working-Money.com, and Traders.com Advantage.
PRINT THIS ARTICLE
SECTOR INVESTING
Energy Stocks Power Up
10/29/01 02:58:33 PMby David Penn
With the DJU testing post-WTC attack lows, a number of energy stocks are working their way upward.
Position: N/A
| While many investors have been mesmerized by the tech-led rally since the September 11th terrorist attack, the fact that most tech stocks are twice as expensive as other S&P 500 stocks (on a P/E valuation basis) has been lost on many. Given the fact that many current investors cut their teeth on tech stocks in the late 1990s, it is easy to understand the attention being paid to them--especially in the wake of the massive losses these equities have sustained. However, if the most money to be made in the markets is to be made catching changes in trends, then those who missed the tech-led rally are probably better off looking for the next bull rally, as opposed to chasing tech stocks that have, as a group, outperformed all other sectors since the attack (S&P 500 tech stocks up 8%. Transports and cyclicals up 8%. Energy up 4%.) |
| The transports/cyclicals have already begun to give way, returning to their pre-9/11 weakness. The tech stocks, on the other hand, continue to perform relatively well, being up 7% over the past two weeks mostly on the back of networking and telecommunications issues. However it is the energy group, the last of our three post-9/11 outperformers that seems the most compelling sector at present, due to low energy commodities prices (though natural gas has been on the move, of late) and a number of promising bottoming formations. |

|
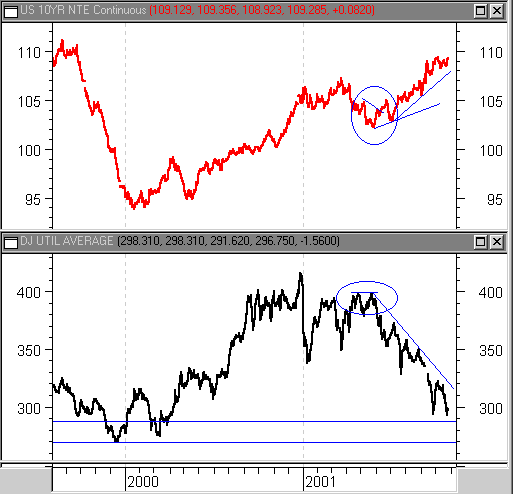
| Divergence between bonds and utilities stocks in mid-2001 anticipated the bursting of the utilities bubble. |
| Graphic provided by: MetaStock. |
| |
| The DJU itself looks set to test end-of-September lows, having been in a steep downtrend since June, the DJU has lost 25% of its value in five months and may be due for a retracement. A rally from its current position could also help set the stage for a double bottom with a neckline at approximately 320, and an upside price target of 350. |
| Insofar as bond prices often lead utilities stocks (see Murphy, Intermarket Technical Analysis), a chart of the 10-year Treasury has been provided. The initial divergence in late spring (the 10-year Treasury made a lower high from May to June while the utilities made comparable highs) set the stage for the current downturn in utilities. While this divergence is stark, it appears that part of the severity of the correction may be due to the bursting of the bubble in utilities stocks that began in the summer of 2000. |
| Ironically, few of the component stocks in the DJU look to be putting in solid bottoms. With the possible exception of Nisource, most of the component stocks are either mired in wide trading ranges or in downtrends that seem as likely to put in new lows as to begin the consolidation necessary for a true bottom. This, at least, is in comparison to a number of other stocks in the energy sector that do appear to have put probable bottoms in place--or, in some cases, are already ramping up. These stocks include oil and gas service stocks such as Baker Hughs and BJ Services, D/E companies such as Noble Drilling and Nabors Industries, and independents like Burlington Resources and Anadarko Petroleum. |
Technical Writer for Technical Analysis of STOCKS & COMMODITIES magazine, Working-Money.com, and Traders.com Advantage.
| Title: | Technical Writer |
| Company: | Technical Analysis, Inc. |
| Address: | 4757 California Avenue SW |
| Seattle, WA 98116 | |
| Phone # for sales: | 206 938 0570 |
| Fax: | 206 938 1307 |
| Website: | www.Traders.com |
| E-mail address: | DPenn@traders.com |
Traders' Resource Links | |
| Charting the Stock Market: The Wyckoff Method -- Books | |
| Working-Money.com -- Online Trading Services | |
| Traders.com Advantage -- Online Trading Services | |
| Technical Analysis of Stocks & Commodities -- Publications and Newsletters | |
| Working Money, at Working-Money.com -- Publications and Newsletters | |
| Traders.com Advantage -- Publications and Newsletters | |
| Professional Traders Starter Kit -- Software | |
Click here for more information about our publications!
Comments

Request Information From Our Sponsors
- VectorVest, Inc.
- Executive Premier Workshop
- One-Day Options Course
- OptionsPro
- Retirement Income Workshop
- Sure-Fire Trading Systems (VectorVest, Inc.)
- Trading as a Business Workshop
- VectorVest 7 EOD
- VectorVest 7 RealTime/IntraDay
- VectorVest AutoTester
- VectorVest Educational Services
- VectorVest OnLine
- VectorVest Options Analyzer
- VectorVest ProGraphics v6.0
- VectorVest ProTrader 7
- VectorVest RealTime Derby Tool
- VectorVest Simulator
- VectorVest Variator
- VectorVest Watchdog
- StockCharts.com, Inc.
- Candle Patterns
- Candlestick Charting Explained
- Intermarket Technical Analysis
- John Murphy on Chart Analysis
- John Murphy's Chart Pattern Recognition
- John Murphy's Market Message
- MurphyExplainsMarketAnalysis-Intermarket Analysis
- MurphyExplainsMarketAnalysis-Visual Analysis
- StockCharts.com
- Technical Analysis of the Financial Markets
- The Visual Investor
