HOT TOPICS LIST
- MACD
- Fibonacci
- RSI
- Gann
- ADXR
- Stochastics
- Volume
- Triangles
- Futures
- Cycles
- Volatility
- ZIGZAG
- MESA
- Retracement
- Aroon
INDICATORS LIST
LIST OF TOPICS
PRINT THIS ARTICLE
by Chaitali Mohile
The two major resistances restricted the price rally of ICON Inc.
Position: N/A
Chaitali Mohile
Active trader in the Indian stock markets since 2003 and a full-time writer. Trading is largely based upon technical analysis.
PRINT THIS ARTICLE
SUPPORT & RESISTANCE
Key Resistances Of Icon
10/15/09 11:41:17 AMby Chaitali Mohile
The two major resistances restricted the price rally of ICON Inc.
Position: N/A
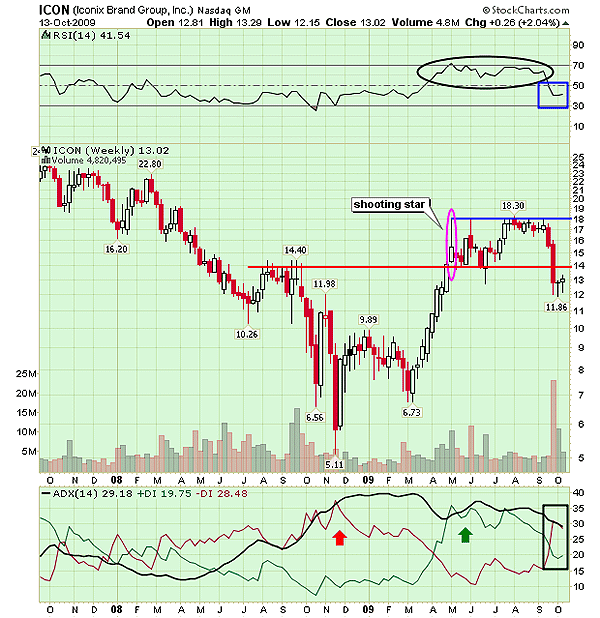
| During a bearish phase in 2008, Iconix Brand Group (ICON) tried to pull back from 14.40 levels. But the strong bearish sentiments stopped the stock by moving upward. The long upper shadows and the doji candles reflected a lack of bullish strength and uncertainty among buyers. The stock plunged to a new low of $5.11. Thus, $14.40 developed a strong resistance zone for the past downward move and for the bullish rally that was initiated after the higher bottom at $6.73. According to Figure 1, the breakout of the resistance at 14.40 was a downtrend reversal. Due to high selling pressure, the average directional movement index (ADX) (14) indicated the overheated downtrend in 2008. The red and the green arrows reflect an overheated downtrend and uptrend, respectively. We can see that the buying pressure indicated by the positive directional index (+DI) bounced as soon as the 14.40 resistance was breached, initiating a fresh uptrend. The ADX (14) never plunged below 25 levels after October 2008; it was the selling and buying pressures that ruled the trend pattern. |

|
| FIGURE 1: ICON, WEEKLY. The stock moved within the support-resistance zone formed by previous highs of the candlestick patterns. |
| Graphic provided by: StockCharts.com. |
| |
| After converting the resistance to support, ICON formed a shooting star candlestick pattern, highlighting a short-term top formation in Figure 1. Although the stock did not correct, it moved sideways under the resistance of the high made by the shooting star at 18. Thereafter, the stock moved within the support-resistance zone of 14 and 18, respectively. The relative strength index (RSI) (14) that ranged between 30 and 50 levels surged in an overbought area. But due to the lack of bullish strength, the momentum oscillator failed to move above the 70 levels. Suddenly, ICON plunged below the support at 14, pulling down the RSI (14). The selling pressure of ADX (14) increased and twisted the well-developed uptrend. Thus, the stock is once again under the key resistance of 14.40. |
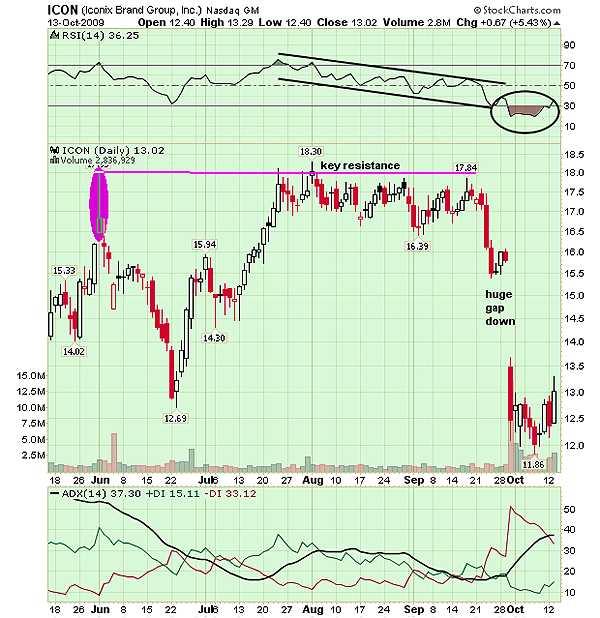
| In June, ICON formed a shooting star on the daily time frame in Figure 2. The colored block shows the bearish reversal candlestick formation -- the shooting star. The overheated uptrend in June confirmed the trend reversal candlestick formation. We can see that the ADX (14) descended from the overheated uptrend levels and the RSI (14) was reluctant to move in an overbought zone. Thus, the shooting star formation resulted in a big loss for the share value of ICON. The high of the candlestick formed the robust resistance for the future rally. The bullish rally of mid-June consolidated under the same resistance, marking a key resistance for the stock at the 18 level. |

|
| FIGURE 2: ICON, DAILY. The long shadow of the shooting star candlestick pattern formed the robust resistance for the bullish rally. |
| Graphic provided by: StockCharts.com. |
| |
| The declining RSI (14) during the price consolidation reflected high volatility and a negative divergence. However, the stock hardly drifted due to the negative divergence. A huge gap down amazed the sellers waiting on the sidelines. Currently, ICON is in a dangerous trading zone that would whipsaw the smartest trader. The RSI (14) has climbed above an oversold region and the ADX (14) is indicating a developed downtrend. Therefore, no trading options are visible in Figure 2. The two buying signals for future trading would be the gap getting filled and the bullish RSI (14) breaking above the 50 level. Traders can go long in either condition, considering the market condition. In addition, traders should also note that the technical resistance at 14 (weekly time frame) is converted into support. |
| Thus, the key resistance is likely to unnerve the positive sentiments and the attractive bullish rally of ICON in the future. |
Active trader in the Indian stock markets since 2003 and a full-time writer. Trading is largely based upon technical analysis.
| Company: | Independent |
| Address: | C1/3 Parth Indraprasth Towers. Vastrapur |
| Ahmedabad, Guj 380015 | |
| E-mail address: | chaitalimohile@yahoo.co.in |
Traders' Resource Links | |
| Independent has not added any product or service information to TRADERS' RESOURCE. | |
Click here for more information about our publications!
PRINT THIS ARTICLE

Request Information From Our Sponsors
- StockCharts.com, Inc.
- Candle Patterns
- Candlestick Charting Explained
- Intermarket Technical Analysis
- John Murphy on Chart Analysis
- John Murphy's Chart Pattern Recognition
- John Murphy's Market Message
- MurphyExplainsMarketAnalysis-Intermarket Analysis
- MurphyExplainsMarketAnalysis-Visual Analysis
- StockCharts.com
- Technical Analysis of the Financial Markets
- The Visual Investor
- VectorVest, Inc.
- Executive Premier Workshop
- One-Day Options Course
- OptionsPro
- Retirement Income Workshop
- Sure-Fire Trading Systems (VectorVest, Inc.)
- Trading as a Business Workshop
- VectorVest 7 EOD
- VectorVest 7 RealTime/IntraDay
- VectorVest AutoTester
- VectorVest Educational Services
- VectorVest OnLine
- VectorVest Options Analyzer
- VectorVest ProGraphics v6.0
- VectorVest ProTrader 7
- VectorVest RealTime Derby Tool
- VectorVest Simulator
- VectorVest Variator
- VectorVest Watchdog
