HOT TOPICS LIST
- MACD
- Fibonacci
- RSI
- Gann
- ADXR
- Stochastics
- Volume
- Triangles
- Futures
- Cycles
- Volatility
- ZIGZAG
- MESA
- Retracement
- Aroon
INDICATORS LIST
LIST OF TOPICS
PRINT THIS ARTICLE
by Austin Passamonte
Here's the near-term to medium-term outlook for sugar futures.
Position: N/A
Austin Passamonte
Austin is a private trader who trades emini stock index futures intraday. He currently trades various futures markets from home in addition to managing a trader's educational forum
PRINT THIS ARTICLE
How Sweet Is It?
10/14/09 09:04:00 AMby Austin Passamonte
Here's the near-term to medium-term outlook for sugar futures.
Position: N/A
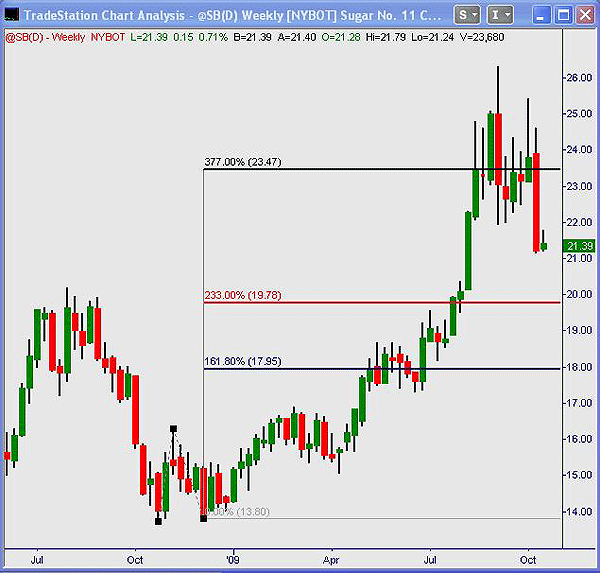
| One of the biggest commodity bull runs this year has been staged in #11 sugar futures. Lows of less than $15 to highs of greater than $26 inside 2009 was one heckuva run. At $1,120 per SB contract on a one-cent move, sugar sure did cover some ground. |

|
| FIGURE 1: SUGAR, WEEKLY |
| Graphic provided by: TradeStation. |
| |
| Things got a little spiky or whippy from 23 cents through 26 cents over the summer. Measuring projection from the 1-2-3 swing lows on Figure 1 pegs high resistance around $23.50, which certainly did contain the whipsaws. Not drawn is a general diamond pattern of mirror wedges, which usually forecasts lower price ahead. In this case, we see exactly that. |

|
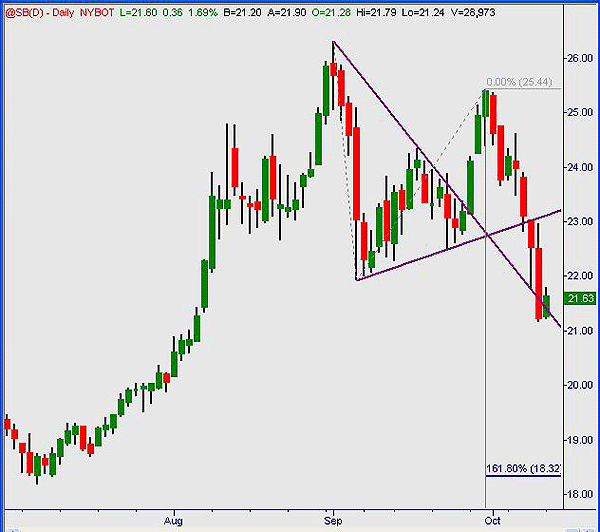
| FIGURE 2: SUGAR, DAILY |
| Graphic provided by: TradeStation. |
| |
| Second half of that diamond pattern is this broken wedge as depicted in Figure 2. See where price coiled tightly, then broke upside hard for three days? The subsequent reversal makes it appear to be a blowoff high, due for a measured pullback to 18+ range via 1-2-3 projection lower. |

|
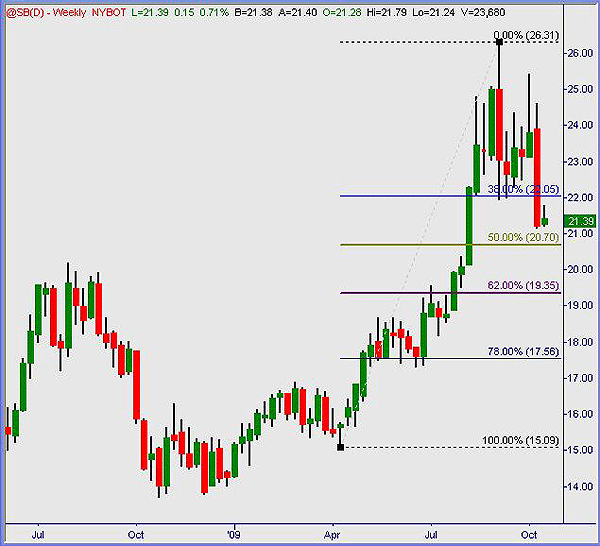
| FIGURE 3: SUGAR, WEEKLY |
| Graphic provided by: TradeStation. |
| |
| That zone correlates to a 62% pullback from a low to high swing near the 19-cent zone (Figure 3). Parabolic moves like that often resolve themselves in diametric fashion... the other way; 19+ to 20-cent range is layered support and should hold a pullback consolidation if further upside has any potential to come. |
| Sugar made some sharp moves following a steady ascent this year. It's only natural for it to relax a bit, consolidate extreme swings, and look for direction ahead from there. |
Austin is a private trader who trades emini stock index futures intraday. He currently trades various futures markets from home in addition to managing a trader's educational forum
| Title: | Individual Trader |
| Company: | CoiledMarkets.com |
| Address: | PO Box 633 |
| Naples, NY 14512 | |
| Website: | coiledmarkets.com/blog |
| E-mail address: | austinp44@yahoo.com |
Traders' Resource Links | |
| CoiledMarkets.com has not added any product or service information to TRADERS' RESOURCE. | |
Click here for more information about our publications!
PRINT THIS ARTICLE

Request Information From Our Sponsors
- VectorVest, Inc.
- Executive Premier Workshop
- One-Day Options Course
- OptionsPro
- Retirement Income Workshop
- Sure-Fire Trading Systems (VectorVest, Inc.)
- Trading as a Business Workshop
- VectorVest 7 EOD
- VectorVest 7 RealTime/IntraDay
- VectorVest AutoTester
- VectorVest Educational Services
- VectorVest OnLine
- VectorVest Options Analyzer
- VectorVest ProGraphics v6.0
- VectorVest ProTrader 7
- VectorVest RealTime Derby Tool
- VectorVest Simulator
- VectorVest Variator
- VectorVest Watchdog
- StockCharts.com, Inc.
- Candle Patterns
- Candlestick Charting Explained
- Intermarket Technical Analysis
- John Murphy on Chart Analysis
- John Murphy's Chart Pattern Recognition
- John Murphy's Market Message
- MurphyExplainsMarketAnalysis-Intermarket Analysis
- MurphyExplainsMarketAnalysis-Visual Analysis
- StockCharts.com
- Technical Analysis of the Financial Markets
- The Visual Investor
