HOT TOPICS LIST
- MACD
- Fibonacci
- RSI
- Gann
- ADXR
- Stochastics
- Volume
- Triangles
- Futures
- Cycles
- Volatility
- ZIGZAG
- MESA
- Retracement
- Aroon
INDICATORS LIST
LIST OF TOPICS
PRINT THIS ARTICLE
by Donald W. Pendergast, Jr.
An update of the Fidelity Select Sector funds reveals a significant changing of the guard. Gold equities are now the top dog, with other stocks from the materials and natural resources groups also vying for the top rankings.
Position: N/A
Donald W. Pendergast, Jr.
Donald W. Pendergast is a financial markets consultant who offers specialized services to stock brokers and high net worth individuals who seek a better bottom line for their portfolios.
PRINT THIS ARTICLE
REL. STR COMPARATIVE
Gold Equities Power To The Forefront
10/13/09 09:22:51 AMby Donald W. Pendergast, Jr.
An update of the Fidelity Select Sector funds reveals a significant changing of the guard. Gold equities are now the top dog, with other stocks from the materials and natural resources groups also vying for the top rankings.
Position: N/A
| Running periodic relative strength rankings on all the major stock industry groups can help provide you with valuable insights, not the least of which is the ability to locate the stocks that are advancing or declining rapidly within the ranks of the various groups. Right now, major group rotation is evident as the entire technology sector has begun to falter, with the precious metals/natural resources and basic materials industry groups quickly taking over the top positions in the ranking. Let's take a closer look now to determine which groups are likely to remain strong. |

|
| FIGURE 1: SIX FUNDS. The similarity of the three-month returns in these six funds is amazing, given the lack of fundamental correlation among several of these industry groups. The strength of broad market moves during the same time period affords at least a partial explanation for the similar performances. |
| Graphic provided by: MetaStock. |
| Graphic provided by: MetaStock Explorer. |
| |
| Here's the current ranking — these are the top six performers based on a weighted average of the three-, six-, and 12-month performances of the 40 Fidelity Select Sector funds that I track every week (Figure 1). The gold (FSAGX) and automotive (FSAVX) funds are very close in the final score: 84.48 to 82.19, with the automotive group being the top performer over the past six months. You'll also note that all of the top six funds are nearly identical in performance over the past three months (see green highlighted area), which is very interesting, since it was exactly three months ago that the Standard & Poor's 500 put in a major weekly cycle low on July 10, 2009, then proceeded to run significantly higher. This is one of the best pieces of evidence I've ever seen that proves that the overall strength of the broad market is the primary driver of returns among the various industry groups. It's amazing to consider six different funds all returned just about the same amount of profit during the same three-month period in which the broad market was also in an extremely bullish configuration. The message here is simple: When the probabilities favor the broad market moving higher (especially in the wake of anticipated weekly cycle lows), deploy your trading capital into the industry groups and sectors with the best relative strength. Conversely, when the broad markets are configured in such a fashion that the probabilities favor a sustained period of weakness, either go to cash or seek to short the most fundamentally flawed stocks from the weakest relative strength industry groups. Going further, the chart also displays just how strong the gold mining stocks have been over the past 12 months or so, overpowering every other Select Sector fund. With gold itself in record price territory and with its quarterly price cycles also ready to make a bullish crossover above a major signal line, it might be a safe bet to assume that gold stocks will remain a serious buy on normal daily and weekly pullbacks. Also worthy of note are the stocks from the natural gas industry group, which are also getting close to a bullish quarterly price cycle crossover. And since they are recovering from one of the most devastating industry group crashes of recent history, there is a good possibility that this group can continue to outperform for some time. Watching how the rankings change every week is one of the best ways to determine just how far this fund can move; who knows, a year from now it may eventually replace the gold mining stocks at the top of the list. In the meantime, continue to monitor all of the funds shown for possible long entry setups on a daily or weekly pullback to support. |

|
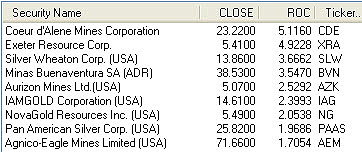
| FIGURE 2: MINING STOCKS. The top nine gold/silver mining stocks, based on a 13-week rate of change calculation vs.the Fidelity Select Sector Gold fund (FSAGX). |
| Graphic provided by: MetaStock. |
| Graphic provided by: Metastock's Explorer. |
| |
| Figure 2 shows the top-ranked gold and silver mining stocks, based on a 13-week rate of change calculation versus the Fidelity Select Sector Gold fund (FSAGX). Waiting for pullbacks to meaningful support in any of these stocks could be a good strategy for those wishing to play the long side. |

|
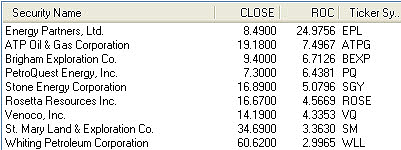
| FIGURE 3: OIL/GAS INDUSTRY STOCKS. The top nine oil/gas industry stocks, based on a 13-week rate of change calculation vs.the Fidelity Select Sector Natural Gas fund (FSNGX). |
| Graphic provided by: MetaStock. |
| Graphic provided by: MetaStock Explorer. |
| |
| Last but not least, Figure 3 shows the the top-ranked oil and gas stocks, based on a 13-week rate of change calculation versus the Fidelity Select Sector Natural Gas fund (FSNGX). Again, watching for pullbacks to strong daily and weekly support could be an excellent strategy for those wishing to play the long side in the oil and gas industry group. |
Donald W. Pendergast is a financial markets consultant who offers specialized services to stock brokers and high net worth individuals who seek a better bottom line for their portfolios.
| Title: | Writer, market consultant |
| Company: | Linear Trading Systems LLC |
| Jacksonville, FL 32217 | |
| Phone # for sales: | 904-239-9564 |
| E-mail address: | lineartradingsys@gmail.com |
Traders' Resource Links | |
| Linear Trading Systems LLC has not added any product or service information to TRADERS' RESOURCE. | |
Click here for more information about our publications!
Comments
Date: 10/14/09Rank: 3Comment:

Request Information From Our Sponsors
- StockCharts.com, Inc.
- Candle Patterns
- Candlestick Charting Explained
- Intermarket Technical Analysis
- John Murphy on Chart Analysis
- John Murphy's Chart Pattern Recognition
- John Murphy's Market Message
- MurphyExplainsMarketAnalysis-Intermarket Analysis
- MurphyExplainsMarketAnalysis-Visual Analysis
- StockCharts.com
- Technical Analysis of the Financial Markets
- The Visual Investor
- VectorVest, Inc.
- Executive Premier Workshop
- One-Day Options Course
- OptionsPro
- Retirement Income Workshop
- Sure-Fire Trading Systems (VectorVest, Inc.)
- Trading as a Business Workshop
- VectorVest 7 EOD
- VectorVest 7 RealTime/IntraDay
- VectorVest AutoTester
- VectorVest Educational Services
- VectorVest OnLine
- VectorVest Options Analyzer
- VectorVest ProGraphics v6.0
- VectorVest ProTrader 7
- VectorVest RealTime Derby Tool
- VectorVest Simulator
- VectorVest Variator
- VectorVest Watchdog
