HOT TOPICS LIST
- MACD
- Fibonacci
- RSI
- Gann
- ADXR
- Stochastics
- Volume
- Triangles
- Futures
- Cycles
- Volatility
- ZIGZAG
- MESA
- Retracement
- Aroon
INDICATORS LIST
LIST OF TOPICS
PRINT THIS ARTICLE
by Austin Passamonte
Here's the short-term to near-term outlook for soybean futures market.
Position: N/A
Austin Passamonte
Austin is a private trader who trades emini stock index futures intraday. He currently trades various futures markets from home in addition to managing a trader's educational forum
PRINT THIS ARTICLE
TECHNICAL ANALYSIS
Bean Sprouts
10/13/09 08:42:05 AMby Austin Passamonte
Here's the short-term to near-term outlook for soybean futures market.
Position: N/A
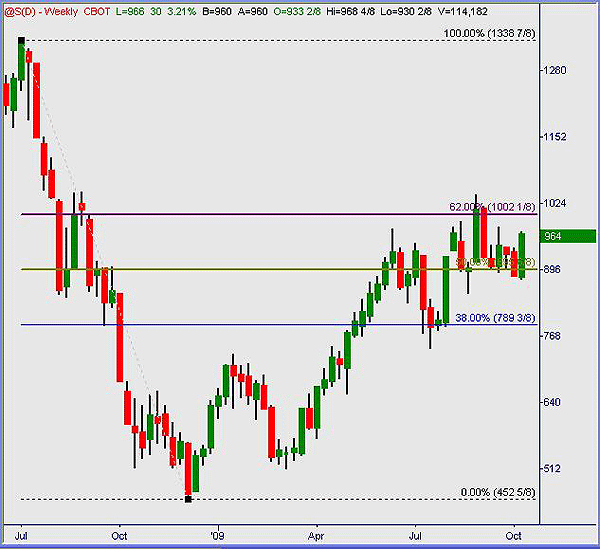
| Soybean futures (ZS) have spent the better part of 2009 recovering from the epic slide off peak highs in 2008. The trip from more than $13 a bushel to less than $5 a bushel was quite the decline. At $5,000 per $1 bushel price value change, we're talking $40,000 per ZS contract short from peak to trough. Putting that into context of S&P futures (ES contract) price movement, it would be 800 index points' decline — a pretty big move in a few months' time. Figure 1. |

|
| FIGURE 1: BEANS, WEEKLY |
| Graphic provided by: TradeStation. |
| |
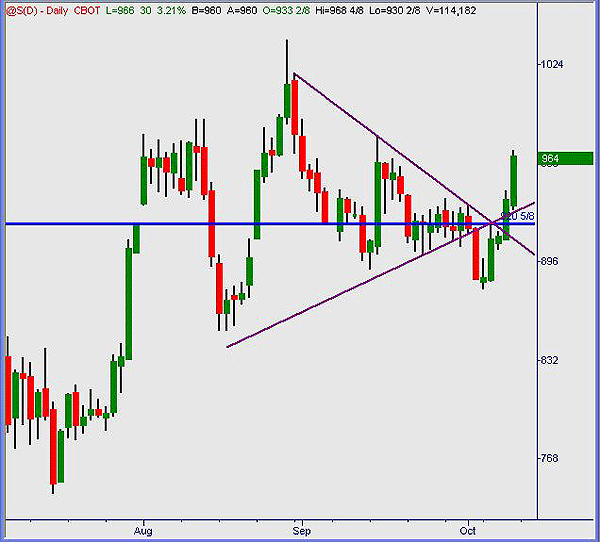
| Since the late 2008 lows, price bounced off a 1-2-3 bottom and recovered 50% of the range to date. Bean futures have rolled there since June, consolidating in a wide-range fashion for the next push up or down. So far, the 62% retracement level near the $10 zone has been resistance in this cycle. See Figure 2. |

|
| FIGURE 2: BEANS, DAILY |
| Graphic provided by: TradeStation. |
| |
| Dialing into the daily-chart view, $9.20 has been a trendline magnet for price since early August. A clean release will happen eventually, and it looks to be upside from here. See where price broke down through the wedge (purple lines) in a bearish fashion? That pullback up into resistance (blue line) attracted sellers right there with buy-stops clustered at or above 921. Now that the wedge faked out the downside break, subsequent upside breakout has those trapped shorts covering while new buyers step in. This classic "oops trade" failed a downside pattern = strong upside signal. |

|
| FIGURE 3: BEANS, DAILY |
| Graphic provided by: TradeStation. |
| |
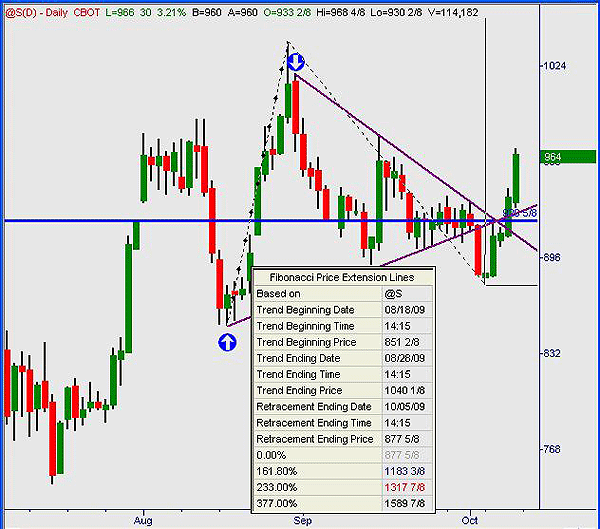
| Blue arrows in Figure 3 marks a wedge low near 850 and a wedge high near 1025 — 175 cents' width range. Projecting the 920 break + 175 higher = 1100 zone is a measured objective. From there it's onto the 1180s and 1300s if or as momentum continues higher. |
| Planting through a harvest season cycle is just about complete. Consumption and usage dictates what comes next. The technical picture remains bullish for beans, perhaps once again in the teens to come. |
Austin is a private trader who trades emini stock index futures intraday. He currently trades various futures markets from home in addition to managing a trader's educational forum
| Title: | Individual Trader |
| Company: | CoiledMarkets.com |
| Address: | PO Box 633 |
| Naples, NY 14512 | |
| Website: | coiledmarkets.com/blog |
| E-mail address: | austinp44@yahoo.com |
Traders' Resource Links | |
| CoiledMarkets.com has not added any product or service information to TRADERS' RESOURCE. | |
Click here for more information about our publications!
Comments
Date: 10/14/09Rank: 4Comment:

Request Information From Our Sponsors
- StockCharts.com, Inc.
- Candle Patterns
- Candlestick Charting Explained
- Intermarket Technical Analysis
- John Murphy on Chart Analysis
- John Murphy's Chart Pattern Recognition
- John Murphy's Market Message
- MurphyExplainsMarketAnalysis-Intermarket Analysis
- MurphyExplainsMarketAnalysis-Visual Analysis
- StockCharts.com
- Technical Analysis of the Financial Markets
- The Visual Investor
- VectorVest, Inc.
- Executive Premier Workshop
- One-Day Options Course
- OptionsPro
- Retirement Income Workshop
- Sure-Fire Trading Systems (VectorVest, Inc.)
- Trading as a Business Workshop
- VectorVest 7 EOD
- VectorVest 7 RealTime/IntraDay
- VectorVest AutoTester
- VectorVest Educational Services
- VectorVest OnLine
- VectorVest Options Analyzer
- VectorVest ProGraphics v6.0
- VectorVest ProTrader 7
- VectorVest RealTime Derby Tool
- VectorVest Simulator
- VectorVest Variator
- VectorVest Watchdog
