HOT TOPICS LIST
- MACD
- Fibonacci
- RSI
- Gann
- ADXR
- Stochastics
- Volume
- Triangles
- Futures
- Cycles
- Volatility
- ZIGZAG
- MESA
- Retracement
- Aroon
INDICATORS LIST
LIST OF TOPICS
PRINT THIS ARTICLE
by David Penn
Even on an intermediate basis, chart patterns often hold form.
Position: N/A
David Penn
Technical Writer for Technical Analysis of STOCKS & COMMODITIES magazine, Working-Money.com, and Traders.com Advantage.
PRINT THIS ARTICLE
HEAD & SHOULDERS
The Canadian Dollar's Complex Head and Shoulders Top
10/23/01 09:51:30 AMby David Penn
Even on an intermediate basis, chart patterns often hold form.
Position: N/A
| Recently getting a copy of the CRB Commodity Yearbook for 2001 delivered to the office, gave me both a renewed interest in futures, as well as in chart patterns. Sometimes, there's nothing like spotting a seven-year, head and shoulders top in the 5-year Treasury Note yield to remind me of how powerful, how telling, chart patterns can be. |
| All the same, an interest in shorter, more tradable time frames often means looking for chart patterns not at all-time tops or bottoms, but at intermediate tops and bottoms. While some chart readers pooh-pooh top and bottom formations unless they occur at the end of the Mother of All Up (or Down) Trends, the fact of the matter is that intermediate moves must come to an end as well, and top and bottom formations--be they double tops or bottoms, head and shoulders patterns, or diamonds--are as good a way to "come to an end" as any. |

|
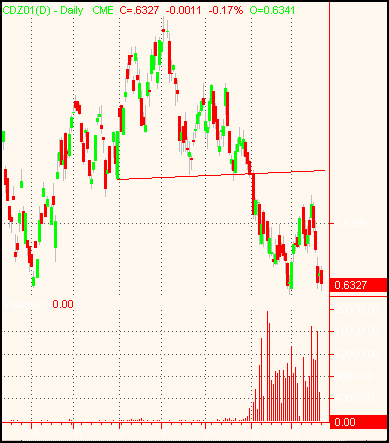
| A breakout, pullback and retest of the lows characterizes this intermediate, complex head and shoulders top. |
| Graphic provided by: TradeStation. |
| |
| Looking at the December Canadian dollar (CDZ1 or CDZ01) provides a textbook example of an intermediate top--a complex head and shoulders top, to be specific--developing and breaking out on the downside. The peak of the complex H&S Top, reached at the beginning of July 2001, is lower at 0.6625 than a previous peak in the Canadian dollar (reached in late January 2001). However, the complex H&S top in the Canadian dollar comes at the top of a four-month intermediate move off of the mid-March lows. In fact, the entire move can be seen as an attempt to take out the previous highs from January. |
| Unfortunately for dollar bulls, the rally ran into resistance early and often, never really challenging the previous high. From May to early August, the Canadian dollar made no less than six minor peaks, almost always returning to a support point at about 0.6444. This support level held for three months from June to September, before a downside breakout completed the formation, sending prices downward rapidly. In fact, prices moved so quickly after the breakout that the price objective of 0.6263 was nearly reached in less than one month. (CDZ01 was at 0.6311 as of this writing, on a retest of the breakout lows.) |
| Even the inevitable pullback, during which the Canadian dollar rallied from mid-September to mid-October, was present--even if it barely tested the breakout area (neckline). The rally has been completely corrected since then, and now threatens to test the breakout lows mentioned above. Whether or not the Canadian dollar reaches the projected low of 0.6263 (projected from the size of the intermediate complex H&S top), it may be worthwhile to begin looking for either continuation or bottoming patterns in the short-term. The rally that led to this particular formation was itself initiated by a small, three-week head and shoulders bottom pattern that developed from March 2001 into May. |
Technical Writer for Technical Analysis of STOCKS & COMMODITIES magazine, Working-Money.com, and Traders.com Advantage.
| Title: | Technical Writer |
| Company: | Technical Analysis, Inc. |
| Address: | 4757 California Avenue SW |
| Seattle, WA 98116 | |
| Phone # for sales: | 206 938 0570 |
| Fax: | 206 938 1307 |
| Website: | www.Traders.com |
| E-mail address: | DPenn@traders.com |
Traders' Resource Links | |
| Charting the Stock Market: The Wyckoff Method -- Books | |
| Working-Money.com -- Online Trading Services | |
| Traders.com Advantage -- Online Trading Services | |
| Technical Analysis of Stocks & Commodities -- Publications and Newsletters | |
| Working Money, at Working-Money.com -- Publications and Newsletters | |
| Traders.com Advantage -- Publications and Newsletters | |
| Professional Traders Starter Kit -- Software | |
Click here for more information about our publications!
Comments
Date: 11/15/01Rank: 4Comment:

Request Information From Our Sponsors
- VectorVest, Inc.
- Executive Premier Workshop
- One-Day Options Course
- OptionsPro
- Retirement Income Workshop
- Sure-Fire Trading Systems (VectorVest, Inc.)
- Trading as a Business Workshop
- VectorVest 7 EOD
- VectorVest 7 RealTime/IntraDay
- VectorVest AutoTester
- VectorVest Educational Services
- VectorVest OnLine
- VectorVest Options Analyzer
- VectorVest ProGraphics v6.0
- VectorVest ProTrader 7
- VectorVest RealTime Derby Tool
- VectorVest Simulator
- VectorVest Variator
- VectorVest Watchdog
- StockCharts.com, Inc.
- Candle Patterns
- Candlestick Charting Explained
- Intermarket Technical Analysis
- John Murphy on Chart Analysis
- John Murphy's Chart Pattern Recognition
- John Murphy's Market Message
- MurphyExplainsMarketAnalysis-Intermarket Analysis
- MurphyExplainsMarketAnalysis-Visual Analysis
- StockCharts.com
- Technical Analysis of the Financial Markets
- The Visual Investor
