HOT TOPICS LIST
- MACD
- Fibonacci
- RSI
- Gann
- ADXR
- Stochastics
- Volume
- Triangles
- Futures
- Cycles
- Volatility
- ZIGZAG
- MESA
- Retracement
- Aroon
INDICATORS LIST
LIST OF TOPICS
PRINT THIS ARTICLE
by Chaitali Mohile
The various bullish breakouts helped the Brazil iShares hit a 52-week high. Technically, the chart looks very promising even above the recent high.
Position: Buy
Chaitali Mohile
Active trader in the Indian stock markets since 2003 and a full-time writer. Trading is largely based upon technical analysis.
PRINT THIS ARTICLE
TECHNICAL ANALYSIS
Brazil ishares At 52-Week High
10/12/09 11:55:30 AMby Chaitali Mohile
The various bullish breakouts helped the Brazil iShares hit a 52-week high. Technically, the chart looks very promising even above the recent high.
Position: Buy
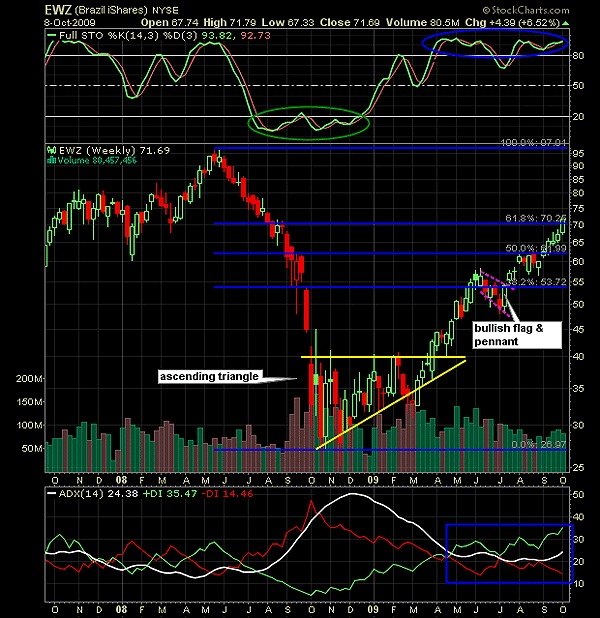
| An ascending triangle is a bullish continuous pattern when formed in an uptrend, but the same pattern is considered as a trend reversal if it appears in a downtrend. Therefore, an ascending triangle in Figure 1 was a major trend reversal pattern for the Brazil iShares (EWZ). According to the trend indicator, the average directional movement index (ADX) (14), the downtrend for EWZ was highly overheated and ready to descend. Another trend reversal indication was an oversold full stochastic (14,3,3) in Figure 1. Thus, the indicators reconfirmed the ascending triangle as the trend reversal pattern. The robust breakout soon carried EWZ above the 38.2% Fibonacci retracement level. The ascending triangle breakout target of 54 (40 - 26 = 14 + 40 = 54) coincided with the Fibonacci retracement level. This resulted in a consolidation in a declining range. |

|
| FIGURE 1: EWZ, WEEKLY. The ascending triangle formed after a robust correction in an EWZ-generated trend reversal situation. The breakout from the triangular pattern developed the bullish flag & pennant formation. |
| Graphic provided by: StockCharts.com. |
| |
| The dashed line in Figure 1 shows a short-term bullish flag & pennant formation. On the next Fibonacci retracement level at 50%, EWZ consolidated marginally. The bullish force existing in the pattern was so strong that the stock breached the resistance level immediately. The potential target on the flag & pennant pattern is measured by adding the length of the advance rally to the breakout level. Therefore, 55 - 40 = 15 is the length of the advance rally, adding 15 to 55 (the breakout level) and we get the target of 70. But before hitting the estimated target, EWZ made a 52-week high marginally below the 70 level. The Fibonacci retracement level of 61.8% intercepts exactly at 70 in Figure 1. |
| Therefore, EWZ has reached the most important resistance level. The breakout from this level would pull the stock to its previous high at 95 levels. The stochastic oscillator is rallying comfortably in an overbought area, and the ADX (14) is indicating a developing uptrend. Therefore, the technical conditions on Figure 1 are suggesting a bullish breakout of the current resistance level. But the possibility of a consolidation cannot be ruled out since the resistance and 52-week high are double trouble for EWZ. I would recommend fresh long positions on the confirmed breakout only. |
Active trader in the Indian stock markets since 2003 and a full-time writer. Trading is largely based upon technical analysis.
| Company: | Independent |
| Address: | C1/3 Parth Indraprasth Towers. Vastrapur |
| Ahmedabad, Guj 380015 | |
| E-mail address: | chaitalimohile@yahoo.co.in |
Traders' Resource Links | |
| Independent has not added any product or service information to TRADERS' RESOURCE. | |
Click here for more information about our publications!
Comments
Date: 10/12/09Rank: 3Comment:

Request Information From Our Sponsors
- StockCharts.com, Inc.
- Candle Patterns
- Candlestick Charting Explained
- Intermarket Technical Analysis
- John Murphy on Chart Analysis
- John Murphy's Chart Pattern Recognition
- John Murphy's Market Message
- MurphyExplainsMarketAnalysis-Intermarket Analysis
- MurphyExplainsMarketAnalysis-Visual Analysis
- StockCharts.com
- Technical Analysis of the Financial Markets
- The Visual Investor
- VectorVest, Inc.
- Executive Premier Workshop
- One-Day Options Course
- OptionsPro
- Retirement Income Workshop
- Sure-Fire Trading Systems (VectorVest, Inc.)
- Trading as a Business Workshop
- VectorVest 7 EOD
- VectorVest 7 RealTime/IntraDay
- VectorVest AutoTester
- VectorVest Educational Services
- VectorVest OnLine
- VectorVest Options Analyzer
- VectorVest ProGraphics v6.0
- VectorVest ProTrader 7
- VectorVest RealTime Derby Tool
- VectorVest Simulator
- VectorVest Variator
- VectorVest Watchdog
