HOT TOPICS LIST
- MACD
- Fibonacci
- RSI
- Gann
- ADXR
- Stochastics
- Volume
- Triangles
- Futures
- Cycles
- Volatility
- ZIGZAG
- MESA
- Retracement
- Aroon
INDICATORS LIST
LIST OF TOPICS
PRINT THIS ARTICLE
by Koos van der Merwe
VMWare is a stock that reached the stratosphere and as the market collapsed, fell like Icarus as its wings melted. Today, it looks as if those wings have been repaired.
Position: Buy
Koos van der Merwe
Has been a technical analyst since 1969, and has worked as a futures and options trader with First Financial Futures in Johannesburg, South Africa.
PRINT THIS ARTICLE
TREND-CHANNEL
Flying With VMWare
10/08/09 02:58:31 PMby Koos van der Merwe
VMWare is a stock that reached the stratosphere and as the market collapsed, fell like Icarus as its wings melted. Today, it looks as if those wings have been repaired.
Position: Buy
| VMWare (VMW) is a leader in virtualization solutions, bringing cloud computing to businesses of all sizes. With 2008 revenues of $1.9 billion, more than 150,000 customers and more than 22,000 partners, VMWare is one of the fastest growing public software companies. Headquartered in Palo Alto, CA, VMWare is majority-owned by EMC Corp. (EMC). |

|
| FIGURE 1: VMWARE, WEEKLY |
| Graphic provided by: AdvancedGET. |
| |
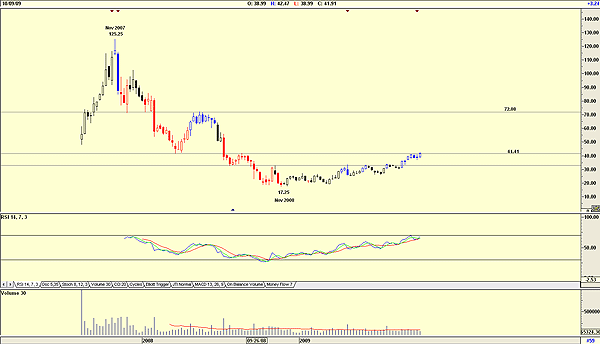
| Figure 1, a weekly chart of VMWare, shows how the price has fallen from a high of $125.25 in November 2007 to a low of $17.25 by November 2008. Since then, the stock price has been gradually climbing, testing, and breaking resistance lines on its way up. The price is currently testing and has a high that peaked above the present resistance level of $41.41. A strong move above this level will suggest a strong buy with the next resistance level at $72.08. Volume is average, and the relative strength index (RSI) is still rising. |

|
| FIGURE 2: VMWARE, DAILY |
| Graphic provided by: AdvancedGET. |
| |
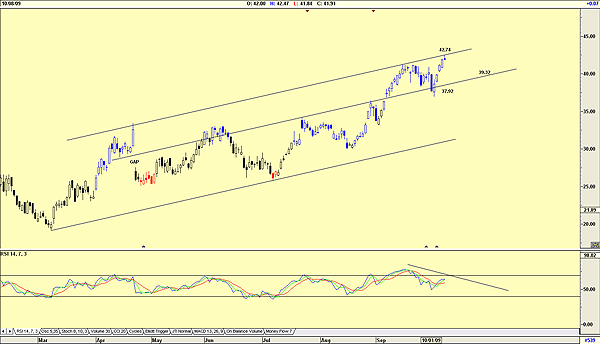
| Figure 2, a daily chart, shows that the price is currently testing the upper resistance trendline at $42.74 after bouncing off the resistance line drawn parallel to the support line from tested pivot points. The RSI is falling, suggesting further short-term weakness ahead. |

|
| FIGURE 3: VMWARE, BUY CHART |
| Graphic provided by: Omnitrader. |
| |
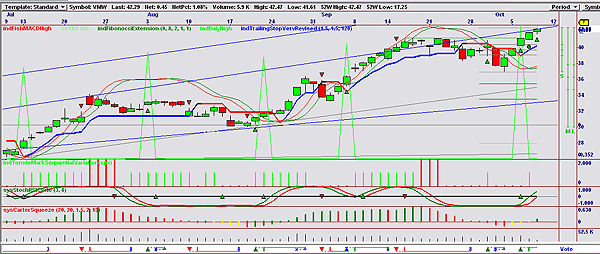
| Figure 3 is an OmniTrader chart showing the following: 1. Price with a trailing stop showing blue as a buy signal and red as a sell signal. The chart shows that a buy signal was given four days ago. 2. Buy high indicator when the closing price is greater than the price of four days ago. This indicator gave a buy signal three days ago. 3. Tom De Mark indicator. This indicator gave a buy signal six days ago and repeated it. 4. The Carter squeeze indicator, showing that the price is rising in a buy signal. 5. The stochastic RSI cycle indicator, suggesting that the price is at oversold levels and rising. A buy signal has been given. 6. The vote line, showing that a buy signal was given four days ago. With VMWare, Icarus seems to be flying once again. Wings have been repaired and without a doubt, as the Dow Jones Industrial Average (DJIA) recovers, so will VMWare. The share is a buy at present levels, with a target once it breaks above the resistance levels of $70. |
Has been a technical analyst since 1969, and has worked as a futures and options trader with First Financial Futures in Johannesburg, South Africa.
| Address: | 3256 West 24th Ave |
| Vancouver, BC | |
| Phone # for sales: | 6042634214 |
| E-mail address: | petroosp@gmail.com |
Click here for more information about our publications!
Comments
Date: 10/12/09Rank: 4Comment:
Date: 10/13/09Rank: 5Comment:

Request Information From Our Sponsors
- StockCharts.com, Inc.
- Candle Patterns
- Candlestick Charting Explained
- Intermarket Technical Analysis
- John Murphy on Chart Analysis
- John Murphy's Chart Pattern Recognition
- John Murphy's Market Message
- MurphyExplainsMarketAnalysis-Intermarket Analysis
- MurphyExplainsMarketAnalysis-Visual Analysis
- StockCharts.com
- Technical Analysis of the Financial Markets
- The Visual Investor
- VectorVest, Inc.
- Executive Premier Workshop
- One-Day Options Course
- OptionsPro
- Retirement Income Workshop
- Sure-Fire Trading Systems (VectorVest, Inc.)
- Trading as a Business Workshop
- VectorVest 7 EOD
- VectorVest 7 RealTime/IntraDay
- VectorVest AutoTester
- VectorVest Educational Services
- VectorVest OnLine
- VectorVest Options Analyzer
- VectorVest ProGraphics v6.0
- VectorVest ProTrader 7
- VectorVest RealTime Derby Tool
- VectorVest Simulator
- VectorVest Variator
- VectorVest Watchdog
