HOT TOPICS LIST
- MACD
- Fibonacci
- RSI
- Gann
- ADXR
- Stochastics
- Volume
- Triangles
- Futures
- Cycles
- Volatility
- ZIGZAG
- MESA
- Retracement
- Aroon
INDICATORS LIST
LIST OF TOPICS
PRINT THIS ARTICLE
by Chaitali Mohile
A long-term bearish reversal pattern is formed by the Semiconductor Index on a daily as well as a weekly time frame. Will the pattern undergo a successful bearish breakout?
Position: Buy
Chaitali Mohile
Active trader in the Indian stock markets since 2003 and a full-time writer. Trading is largely based upon technical analysis.
PRINT THIS ARTICLE
WEDGE FORMATIONS
A Rising Wedge Formed By Semiconductor Index
10/08/09 02:55:54 PMby Chaitali Mohile
A long-term bearish reversal pattern is formed by the Semiconductor Index on a daily as well as a weekly time frame. Will the pattern undergo a successful bearish breakout?
Position: Buy
| A rising wedge or a bearish wedge is formed by a contracting range. The wedge is wider at the beginning and converges at the tail, suggesting the possibility of a bearish breakout. During the breakout, the lower trendline is breached on huge volume. The bearish breakout is a strong technical sell signal. The pattern is a bearish reversal pattern in an uptrend, indicating an end to the current uptrend. The Semiconductor Index ($SOX) has formed a long-term rising wedge formation on a daily and weekly time frame. The pattern is considered most reliable and highly influential when it appears on both time frames. |

|
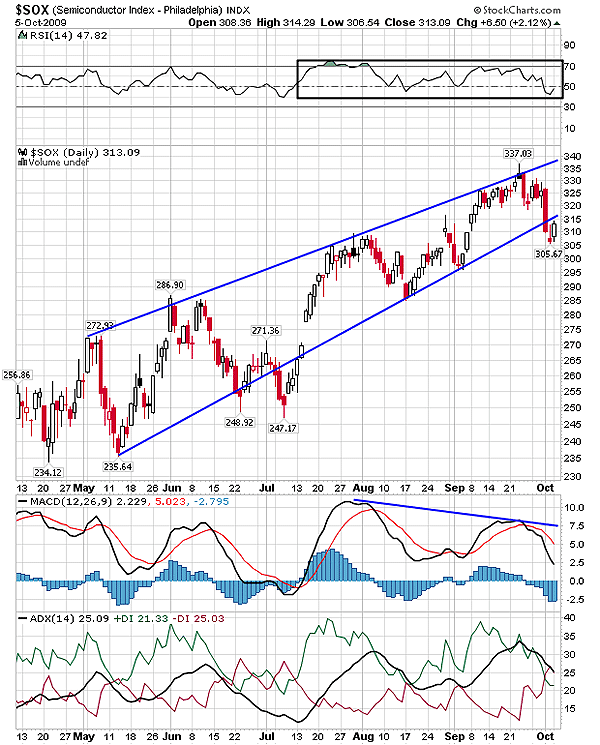
| FIGURE 1: $SOX, DAILY. The rising wedge that seems to be broken downward is likely to jump above the lower trendline. Later, the index would hit the upper trendliine resistance. |
| Graphic provided by: StockCharts.com. |
| |
| Since the pattern in Figure 1 took almost six months to develop, we consider it to be a long-term formation. The lower trendline of the rising wedge was challenged twice, June and July. The wedge was formed by the higher tops and higher bottoms, but the moving average convergence/divergence (MACD) (12,26,9) in Figure 1 formed lower highs, suggesting a negative divergence. The relative strength index (RSI)(14) was range-bound in the bullish region of 50 and 70 levels. This might have encouraged an early breakout of the pattern. We can see that the price plunged below the lower trendline, but it could not sustain because of mixed indications of the indicators. In addition, the average directional movement index (ADX) (14) is indicating a developing uptrend for $SOX. Compared to the earlier movement of the trend indicator, the uptrend has turned weaker. So as far as the trend indicator sustains above 20 levels with encouraging buying pressure, the uptrend would be safe. |
| Thus, we can say that the rising wedge pattern has not matured to undergo a bearish breakout. The MACD (12,26,9) formed a negative divergence in positive territory (above zero line), the RSI (14) is bullish, and the uptrend is developing. Therefore, $SOX is likely to move towards the upper trendline, offering a new buying opportunity for traders. The upward price movement is a strong bullish sign for $SOX. |

|
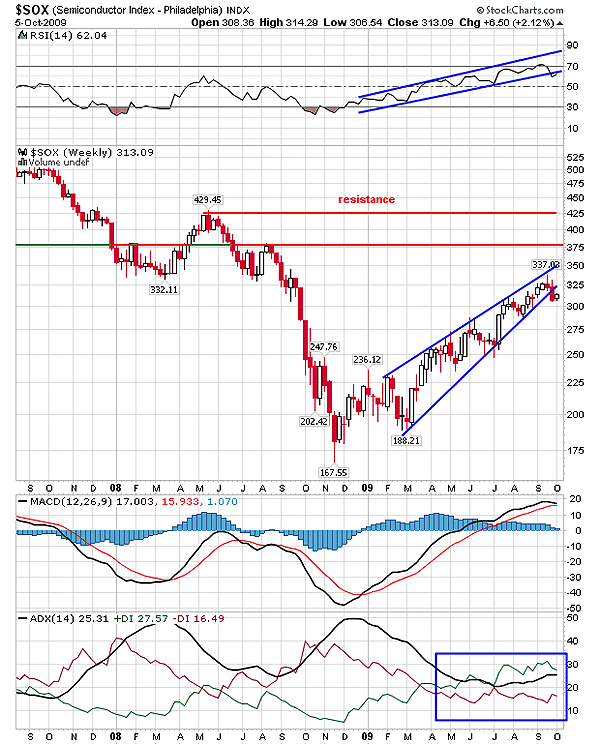
| FIGURE 2: $SOX, WEEKLY. The index is likely to move within the narrow range of the pattern. The support-resistance tool line and the upper red trendline are the two robust hurdles for the bullish journey above the rising wedge. |
| Graphic provided by: StockCharts.com. |
| |
| The rising wedge formed in Figure 2 is almost eight months old. The trading range has narrowed to 25 points. Due to the bullish indicators, the rising wedge is not likely to break down immediately. The past week's bearish rally is followed by a bullish move. The ascending RSI (14) and the healthily positive MACD (12,26,9) has slipped in positive territory and the uptrend is steadily developing. Therefore, $SOX would possibly pull back between the two trendlines. |
| Since the indicators have not turned highly overbought, the rising wedge would continue moving in a narrow range before undergoing the bearish breakout. Although the same pattern has appeared on both time frames, the rising wedge has yet to mature to break in a bearish direction. Traders can observe the price action of $SOX till it plunges below the lower trendline. The current market situations are bullish, so $SOX might take a few weeks to break downward from the rising wedge pattern. |
Active trader in the Indian stock markets since 2003 and a full-time writer. Trading is largely based upon technical analysis.
| Company: | Independent |
| Address: | C1/3 Parth Indraprasth Towers. Vastrapur |
| Ahmedabad, Guj 380015 | |
| E-mail address: | chaitalimohile@yahoo.co.in |
Traders' Resource Links | |
| Independent has not added any product or service information to TRADERS' RESOURCE. | |
Click here for more information about our publications!
Comments
Date: 10/12/09Rank: 2Comment:
Date: 10/23/09Rank: 4Comment:

Request Information From Our Sponsors
- StockCharts.com, Inc.
- Candle Patterns
- Candlestick Charting Explained
- Intermarket Technical Analysis
- John Murphy on Chart Analysis
- John Murphy's Chart Pattern Recognition
- John Murphy's Market Message
- MurphyExplainsMarketAnalysis-Intermarket Analysis
- MurphyExplainsMarketAnalysis-Visual Analysis
- StockCharts.com
- Technical Analysis of the Financial Markets
- The Visual Investor
- VectorVest, Inc.
- Executive Premier Workshop
- One-Day Options Course
- OptionsPro
- Retirement Income Workshop
- Sure-Fire Trading Systems (VectorVest, Inc.)
- Trading as a Business Workshop
- VectorVest 7 EOD
- VectorVest 7 RealTime/IntraDay
- VectorVest AutoTester
- VectorVest Educational Services
- VectorVest OnLine
- VectorVest Options Analyzer
- VectorVest ProGraphics v6.0
- VectorVest ProTrader 7
- VectorVest RealTime Derby Tool
- VectorVest Simulator
- VectorVest Variator
- VectorVest Watchdog
