HOT TOPICS LIST
- MACD
- Fibonacci
- RSI
- Gann
- ADXR
- Stochastics
- Volume
- Triangles
- Futures
- Cycles
- Volatility
- ZIGZAG
- MESA
- Retracement
- Aroon
INDICATORS LIST
LIST OF TOPICS
PRINT THIS ARTICLE
by Donald W. Pendergast, Jr.
Since peaking late last month, the Russell 2000 index has been moving progressively lower toward an anticipated daily cycle low.
Position: N/A
Donald W. Pendergast, Jr.
Donald W. Pendergast is a financial markets consultant who offers specialized services to stock brokers and high net worth individuals who seek a better bottom line for their portfolios.
PRINT THIS ARTICLE
CYCLES
Russell 2000 Cycles And Supports
10/07/09 10:22:45 AMby Donald W. Pendergast, Jr.
Since peaking late last month, the Russell 2000 index has been moving progressively lower toward an anticipated daily cycle low.
Position: N/A
| Based on cycle analysis, the Russell 2000 index is anticipated to bottom out (on the daily time frame) around October 7–12, 2009. Can we also calculate a possible price level at which to expect that reversal, should it arrive as expected? The answer is a qualified "maybe." |

|
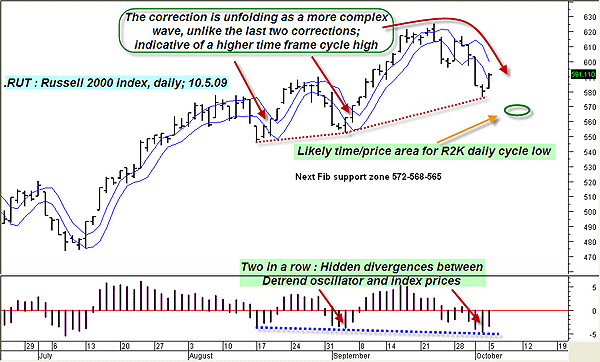
| FIGURE 1: RUT, DAILY. The Russell 2000 index may bottom on its daily cycle by October 7–12, 2009, possibly between 572 and 565. |
| Graphic provided by: MetaStock. |
| Graphic provided by: WB Detrend EOD from ProfitTrader for MetaStock. |
| |
| Figure 1 is the daily chart of the R2K; the index has had a modest retracement move, one lasting a week and a half — so far. Note how this correction has unfolded in a series of small waves, unlike the prior two corrections, both of which were simple pullback-type moves against a strongly rising weekly price cycle. This latest one is deeper, more convoluted, and is more likely than not to test the next set of daily Fibonacci support levels that span the range from 572 to 565. One reason to believe that lower prices are due is that the internal strength readings of the broad market indexes are lower now that they were at the last two swing lows made in August and September, respectively. If this analysis is correct, we may see a briefer selloff (lasting a couple of days) down to the support level prices (572–565), followed by an actual bottoming/reversal confirmation. There is a modestly bullish omen on the R2K daily graph, one that also suggests the worst of this daily selloff is behind us; the detrend oscillator (bottom panel of chart) has tentatively printed its second straight hidden divergence against the index price. You don't see much written about this phenomenon in the traditional technical analysis texts, but it is a very useful tool when placed in the proper context. The concept is simple, if price keeps rising, putting in successively higher swing lows even as the detrend oscillator (or even a relative strength index [RSI], stochastic, commodity channel index [CCI], or stochRSI indicator) keeps making successively lower indicator lows, you have a valid hidden divergence. There will frequently be a reversal higher in the wake of such a divergence, with the strength typically determined by the size of the divergence. It's a fascinating pattern, one with above-average reliability, and that's why we need to watch what happens if and when the R2K gets near our anticipated time/price reversal zone. Even though the weekly cycle in the R2K is still heading down, a tradable relief rally on the daily chart is also a likely occurrence in the next week or so after the final (projected) washout into the daily cycle low. |

|
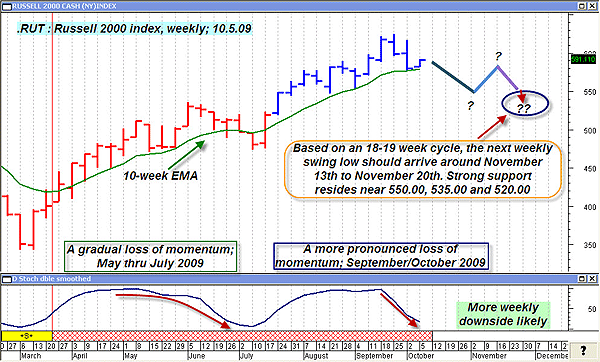
| FIGURE 2: RUT, WEEKLY. While the daily cycle is due to bottom soon, the weekly cycle likely has another five to six weeks to go before a meaningful reversal occurs. |
| Graphic provided by: MetaStock. |
| |
| And now a look at the R2K weekly graph in Figure 2. The double-smoothed stochastic (bottom panel of chart) does a good job of identifying the weekly price cycle in this index, and, right now, it's heading sharply lower with more downside likely to come. The current momentum of the double stochastics is more bearish than that of the previous drop into the July 10, 2009, cycle low, and that suggests that this cycle (currently 13 weeks old) will likely run the full 18 to 19 weeks typically seen in the R2K's weekly price cycle. If that is the case, don't look for a meaningful weekly low until at least mid- to late November 2009. The index does have some solid chart and Fibonacci support ranging from 550 to 520, so as the cycle plays out it should be easier to attempt to pick a more specific date/price to expect a reversal higher. |
| So we have two cycles to watch; the daily cycle, which is anticipated to bottom/reverse within a week or so, and the weekly cycle, which still has another five to six weeks to go before the bulls can finally start to prepare for a possible year-end rally. With the quarterly price cycle pointing higher, such a rally shouldn't be ruled out. |
Donald W. Pendergast is a financial markets consultant who offers specialized services to stock brokers and high net worth individuals who seek a better bottom line for their portfolios.
| Title: | Writer, market consultant |
| Company: | Linear Trading Systems LLC |
| Jacksonville, FL 32217 | |
| Phone # for sales: | 904-239-9564 |
| E-mail address: | lineartradingsys@gmail.com |
Traders' Resource Links | |
| Linear Trading Systems LLC has not added any product or service information to TRADERS' RESOURCE. | |
Click here for more information about our publications!
Comments
Date: 10/07/09Rank: 1Comment:

Request Information From Our Sponsors
- VectorVest, Inc.
- Executive Premier Workshop
- One-Day Options Course
- OptionsPro
- Retirement Income Workshop
- Sure-Fire Trading Systems (VectorVest, Inc.)
- Trading as a Business Workshop
- VectorVest 7 EOD
- VectorVest 7 RealTime/IntraDay
- VectorVest AutoTester
- VectorVest Educational Services
- VectorVest OnLine
- VectorVest Options Analyzer
- VectorVest ProGraphics v6.0
- VectorVest ProTrader 7
- VectorVest RealTime Derby Tool
- VectorVest Simulator
- VectorVest Variator
- VectorVest Watchdog
- StockCharts.com, Inc.
- Candle Patterns
- Candlestick Charting Explained
- Intermarket Technical Analysis
- John Murphy on Chart Analysis
- John Murphy's Chart Pattern Recognition
- John Murphy's Market Message
- MurphyExplainsMarketAnalysis-Intermarket Analysis
- MurphyExplainsMarketAnalysis-Visual Analysis
- StockCharts.com
- Technical Analysis of the Financial Markets
- The Visual Investor
