HOT TOPICS LIST
- MACD
- Fibonacci
- RSI
- Gann
- ADXR
- Stochastics
- Volume
- Triangles
- Futures
- Cycles
- Volatility
- ZIGZAG
- MESA
- Retracement
- Aroon
INDICATORS LIST
LIST OF TOPICS
PRINT THIS ARTICLE
by David Penn
Tops and bottoms notwithstanding, a diamond in a trend often suggests more of the same.
Position: N/A
David Penn
Technical Writer for Technical Analysis of STOCKS & COMMODITIES magazine, Working-Money.com, and Traders.com Advantage.
PRINT THIS ARTICLE
TECHNICAL ANALYSIS
January Lumber's Diamond Continuation
10/18/01 04:05:30 PMby David Penn
Tops and bottoms notwithstanding, a diamond in a trend often suggests more of the same.
Position: N/A
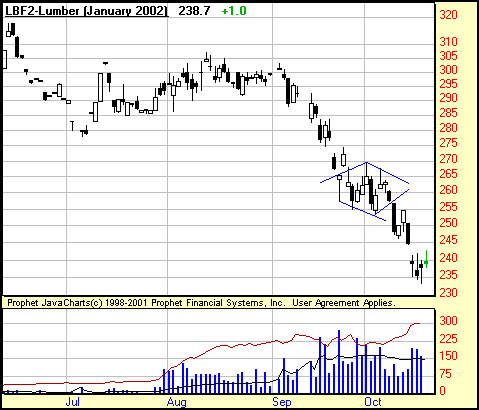
| After a recent run-up in lumber prices to end the summer, prices broke sharply going into autumn, losing 10% from early September to late September. In large part, the break in lumber resembled the break in a great many tradables--from stocks to indexes to commodities--that took place in the wake of the September 11th terrorist attack. While some tradables rebounded sharply and others continued their decline, lumber instead settled into a consolidation pattern to finish the month. |
| Given the pattern of lower highs and higher lows giving way to higher highs and lower lows, then back again to lower highs and higher lows, this consolidation has a distinctive, if not thoroughly symmetrical, diamond shape. While not the most reliable chart patterns in the book, diamond consolidations have a reputation of marking tops and bottoms when they occur during trends. However, as consolidations in trends, it is worthwhile to be on the look-out for failed breakouts in diamond patterns that may signal continuations rather than reversals. |

|
| A strong downward breakout from this diamond consolidation pattern stalls shortly after reaching its price objective of 240. |
| Graphic provided by: ProphetFinance. |
| |
| The best way to determine whether a given diamond pattern is a continuation or reversal pattern is to wait for prices to break out above the top of the diamond (in an uptrend) or below the bottom of the diamond (in a downtrend). Generally speaking, the tops and bottoms of diamonds are the first places to look in terms of resistance and support, respectively. Any breakout that, in addition to moving in the "wrong" direction, also manages to break past resistance in the case of a would-be diamond top or past support in the case of a would-be diamond bottom, may suggest that the profit in the pattern will come not from a new trend, but from a resumption of the old trend. |
| The January lumber contract (LBF2) is a worthwhile example of this. After the September breakdown through an upward trendline, lumber prices declined into a diamond shaped consolidation. This consolidation lasted about 11 days before a very bearish breakdown on October 9th not only took prices out of the pattern, but also below support at the bottom of the pattern at about 255. Even though this move occurred on relatively light volume, the shift in price alone was too significant to be ignored--especially by those playing the diamond more as a reversal pattern. A subsequent, two-day rally failed, and the following bearish session took lumber down 4% from the rally high to 245. |
| What is interesting is that a measurement of the diamond pattern size subtracted from the breakdown point of 255 yields 240, which is precisely where the next move down stalled. Although intraday volatility appears to have increased dramatically vis-a-vis the open and the close--which have been consistently near in price since the move down below 240--the 240 level is acting as effective resistance to any upward move. |
Technical Writer for Technical Analysis of STOCKS & COMMODITIES magazine, Working-Money.com, and Traders.com Advantage.
| Title: | Technical Writer |
| Company: | Technical Analysis, Inc. |
| Address: | 4757 California Avenue SW |
| Seattle, WA 98116 | |
| Phone # for sales: | 206 938 0570 |
| Fax: | 206 938 1307 |
| Website: | www.Traders.com |
| E-mail address: | DPenn@traders.com |
Traders' Resource Links | |
| Charting the Stock Market: The Wyckoff Method -- Books | |
| Working-Money.com -- Online Trading Services | |
| Traders.com Advantage -- Online Trading Services | |
| Technical Analysis of Stocks & Commodities -- Publications and Newsletters | |
| Working Money, at Working-Money.com -- Publications and Newsletters | |
| Traders.com Advantage -- Publications and Newsletters | |
| Professional Traders Starter Kit -- Software | |
Click here for more information about our publications!
Comments

Request Information From Our Sponsors
- VectorVest, Inc.
- Executive Premier Workshop
- One-Day Options Course
- OptionsPro
- Retirement Income Workshop
- Sure-Fire Trading Systems (VectorVest, Inc.)
- Trading as a Business Workshop
- VectorVest 7 EOD
- VectorVest 7 RealTime/IntraDay
- VectorVest AutoTester
- VectorVest Educational Services
- VectorVest OnLine
- VectorVest Options Analyzer
- VectorVest ProGraphics v6.0
- VectorVest ProTrader 7
- VectorVest RealTime Derby Tool
- VectorVest Simulator
- VectorVest Variator
- VectorVest Watchdog
- StockCharts.com, Inc.
- Candle Patterns
- Candlestick Charting Explained
- Intermarket Technical Analysis
- John Murphy on Chart Analysis
- John Murphy's Chart Pattern Recognition
- John Murphy's Market Message
- MurphyExplainsMarketAnalysis-Intermarket Analysis
- MurphyExplainsMarketAnalysis-Visual Analysis
- StockCharts.com
- Technical Analysis of the Financial Markets
- The Visual Investor
