HOT TOPICS LIST
- MACD
- Fibonacci
- RSI
- Gann
- ADXR
- Stochastics
- Volume
- Triangles
- Futures
- Cycles
- Volatility
- ZIGZAG
- MESA
- Retracement
- Aroon
INDICATORS LIST
LIST OF TOPICS
PRINT THIS ARTICLE
by Ron Walker
The study of price behavior can help determine when actual shifts in power occur between buyers and sellers. A 1-2-3 price reversal defines the moment that occurs, clearly spelling out which group is in control.
Position: N/A
Ron Walker
Ron Walker is an active trader and technical analyst. He operates an educational website dedicated to the study of Technical Analysis. The website offers free market analysis with daily video presentations and written commentaries. Ron is a video pioneer, being one of the first to utilize the internet producing Technical Analysis videos. His website is thechartpatterntrader.com
PRINT THIS ARTICLE
REVERSAL
SPY's 1-2-3 Price Reversal
10/07/09 10:12:28 AMby Ron Walker
The study of price behavior can help determine when actual shifts in power occur between buyers and sellers. A 1-2-3 price reversal defines the moment that occurs, clearly spelling out which group is in control.
Position: N/A
| As a trend matures, especially after a steep grade, it is advisable to formulate a contingency plan in anticipation of a reversal. As traders, our job is to anticipate a reversal at its earliest stages rather than act on it after the fact. The earlier you spot a reversal, the greater the reward. The 1-2-3 price reversal is the basic setup. A setup is a price formation that can be acted on using any financial instrument once it has been identified on the price chart. Using a setup allows you to fine-tune your entry points, with a set of predetermined trading rules and guidelines. A trader must abide by certain trading rules in order manage risk properly. Using a setup is essential in lowering risk and allows a trader to keep his/her emotions in check without compromise. The 1-2-3 price reversal keeps us from jumping the gun on a trade and entering it prematurely. The tactics employed in the basic setup is incorporated into the chart patterns we trade each day in some shape or form. |

|
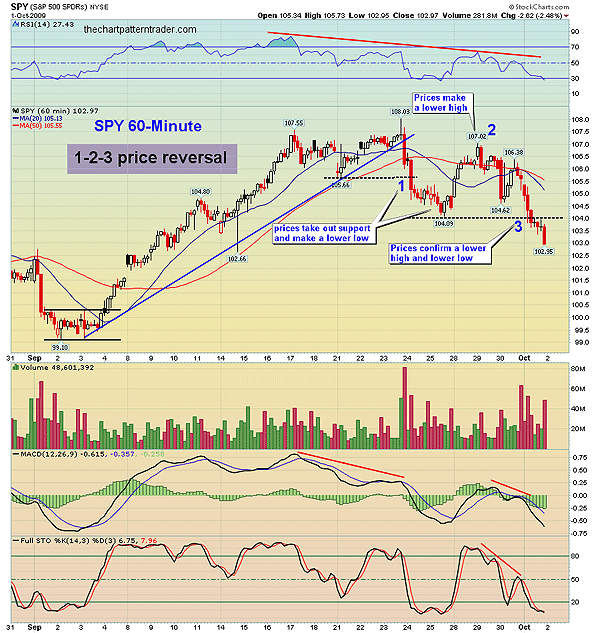
| FIGURE 1: SPY, 60-MINUTE. This bearish 1-2-3 price reversal consisted of a breakdown from a double-top reversal pattern. A light volume rally established a lower high, and then a follow-through of another lower low. |
| Graphic provided by: StockCharts.com. |
| |
| The S&P 500 SPDRs (SPY) is an exchange traded fund (ETF) that mimics the performance of the Standard & Poor's 500. Here we will examine the price action that transpired between September 1 to October 1, on the SPY hourly chart (Figure 1). In early September, SPY bottomed out at $99, moving in a lateral range for several sessions before prices broke out and began a steep climb higher to peak just above $108. On September 23, prices broke the rising trendline that formed during that runup. The following day, prices continued to slide and broke below the previous minor low, which was made prior to the trendline break. Prices hit fresh lows for the first time as they sank down to the $104 level, closing below the 20-period moving average (MA). On September 25 prices bottomed, and then SPY snapped back on light volume the following day, causing prices to overshoot the 50-period MA, closing the week just north of $106. The following Monday, on September 29, prices gapped up and charged toward $107, only to be met with a reversal bar (a bearish engulfing pattern) that printed a lower high in the 60-minute chart. Then prices made a series of lower highs as the 20-period MA got a bearish realignment with the 50-period MA. Unable to exceed the previous price peak, SPY hit the breaks on the advance and began backpedaling as prices edged back down as conditions worsened. Driven by fear, there was a pronounced decline on increasing volume as prices crossed below the previous price threshold. The price threshold is the doorway to a reversal. It is the line in the sand, and once prices cross below it, the downtrend is confirmed. Penetration confirms a lower high and a lower low, offering ample evidence that a price shift has taken place. |
| In this article I will flash the spotlight on a bearish 1-2-3 price reversal, but in a bullish scenario we look for the inverse of this setup. A price reversal is as simple as 1-2-3. Three conditions must accompany a true bearish price reversal. The first condition is that prices must break down from a consolidation or reversal pattern and make a lower low. In this example, SPY is breaking down form a double-top pattern. Second, prices must make a lower high. Prices must be too feeble to continue making higher highs and so create a lower high. Third and finally, prices break below the previous minor low that was made during the last selloff. When two of the three conditions meet, it increases the probability that the third condition will likely be the next logical move to occur. This setup offers three distinct entry points for a trader to get short if specified conditions are met, but in order to manage risk one must abide by the rules of engagement. Remember, the no. 1 cause of financial ruin for a trader is the failure to set protective stop-losses. A short can be taken at point 1 as prices are breaking down from the reversal pattern, which amounts to a failed consolidation. The trade is triggered when prices penetrate below the trough that separates the two peaks. That minor low is the confirmation line of a double-top pattern. A stop should be placed just above the last minor high made near the 108 area. This entry point poses the most risk of the three we will discuss. |
| Once the selling is contained, prices rallied back up to point 2 to retest the prior high. There, a gap occurs, causing prices to peak at $107. After prices gapped higher, the next bar produced a reversal as a bearish engulfing reversal candlestick appeared, failing to set a new high. That put the skids on this attempted recovery rally. Note that after prices put in this lower high, SPY turned and made a series of lower highs. During this reversal, a trader can get short the moment the pivot reversal appears, with an initial stop just above the peak made during that session. The other option at point 2 is to wait until a lower high forms after the pivot reversal has begun or when prices move below the initial minor low made by the pivot reversal. This presents a micro version of the bearish 1-2-3 price reversal that can be seen in the 15-minute time frame (Figure 2). Point 3 shows the follow-through that confirmed the lower high and lower low (Figure 1). The action that should be taken here is simple; we want to short SPY at $0.10 to $0.15 below the previous established low, with an anticipated short entry immediately after the horizontal trendline is fractured. The broken trendline is an indication of weakness after the lower high has been established. Taking a short here at the pivot reversal presents the least amount of risk of the speculative short entries. A more conservative trader can wait for a 60-minute bar to completely form, closing below the horizontal trendline. |

|
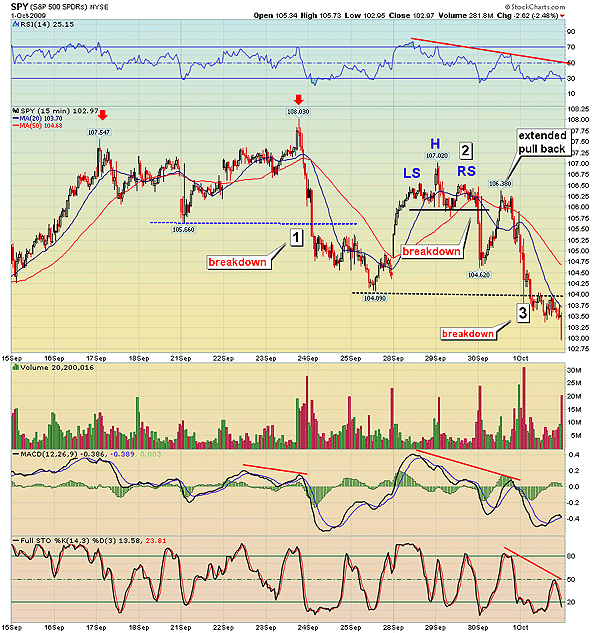
| FIGURE 2: SPY, 15-MINUTE. Here, we see that while a lower high was forming on the hourly chart, a head & shoulders top sealed the fate of a lower high on the 15-minute one. Note the extended pullback above the neckline couldn't exceed the high made in the right shoulder. |
| Graphic provided by: StockCharts.com. |
| |
| In Figure 2, we can see that the 15-minute chart provided helpful information in timing a short entry during point 2 on the hourly chart. Short positions were considered when prices first fell below the 20-period MA on the 60-minute chart, which occurred at point 1 (Figure 1). But the 15-minute chart should be utilized to help us fine-tune our entry points for all the points. I want magnify what is going on in the 15-minute time frame during point number 2. In Figure 2, we see that after prices rallied back up to form point 2, a small head & shoulders top was developing in the 15-minute time frame. A head formed as prices peaked near $107. After that, prices formed a lower high, creating the right shoulder, and collapsed through the neckline. This was also a bearish 1-2-3 price reversal for 15-minute traders. After prices collapsed, there was a brief extended pullback above the neckline, but prices were too weak to clear the peak made at the right shoulder. Resulting in a sharp reversal caused prices to plunge below point 3, confirming the 1-2-3 price reversal on the 60-minute chart. |
Ron Walker is an active trader and technical analyst. He operates an educational website dedicated to the study of Technical Analysis. The website offers free market analysis with daily video presentations and written commentaries. Ron is a video pioneer, being one of the first to utilize the internet producing Technical Analysis videos. His website is thechartpatterntrader.com
| Website: | thechartpatterntrader.com |
| E-mail address: | thechartpatterntrader@gmail.com |
Click here for more information about our publications!
Comments
Date: 10/07/09Rank: 5Comment:

Request Information From Our Sponsors
- StockCharts.com, Inc.
- Candle Patterns
- Candlestick Charting Explained
- Intermarket Technical Analysis
- John Murphy on Chart Analysis
- John Murphy's Chart Pattern Recognition
- John Murphy's Market Message
- MurphyExplainsMarketAnalysis-Intermarket Analysis
- MurphyExplainsMarketAnalysis-Visual Analysis
- StockCharts.com
- Technical Analysis of the Financial Markets
- The Visual Investor
- VectorVest, Inc.
- Executive Premier Workshop
- One-Day Options Course
- OptionsPro
- Retirement Income Workshop
- Sure-Fire Trading Systems (VectorVest, Inc.)
- Trading as a Business Workshop
- VectorVest 7 EOD
- VectorVest 7 RealTime/IntraDay
- VectorVest AutoTester
- VectorVest Educational Services
- VectorVest OnLine
- VectorVest Options Analyzer
- VectorVest ProGraphics v6.0
- VectorVest ProTrader 7
- VectorVest RealTime Derby Tool
- VectorVest Simulator
- VectorVest Variator
- VectorVest Watchdog
