HOT TOPICS LIST
- MACD
- Fibonacci
- RSI
- Gann
- ADXR
- Stochastics
- Volume
- Triangles
- Futures
- Cycles
- Volatility
- ZIGZAG
- MESA
- Retracement
- Aroon
INDICATORS LIST
LIST OF TOPICS
PRINT THIS ARTICLE
by Austin Passamonte
Near-term to mid-term outlook for gold futures index.
Position: N/A
Austin Passamonte
Austin is a private trader who trades emini stock index futures intraday. He currently trades various futures markets from home in addition to managing a trader's educational forum
PRINT THIS ARTICLE
TECHNICAL ANALYSIS
Millennium Gold
10/06/09 09:05:27 AMby Austin Passamonte
Near-term to mid-term outlook for gold futures index.
Position: N/A
| Gold bugs have talked about $1,000 and even $2,000 per ounce gold prices for the past several years. Even when it traded in the $200-plus per ounce, such predictions were common. Well, it may have been a long wait, but at long last, gold has indeed hit the first millennium mark. |

|
| FIGURE 1: GC, DAILY |
| Graphic provided by: TradeStation. |
| |
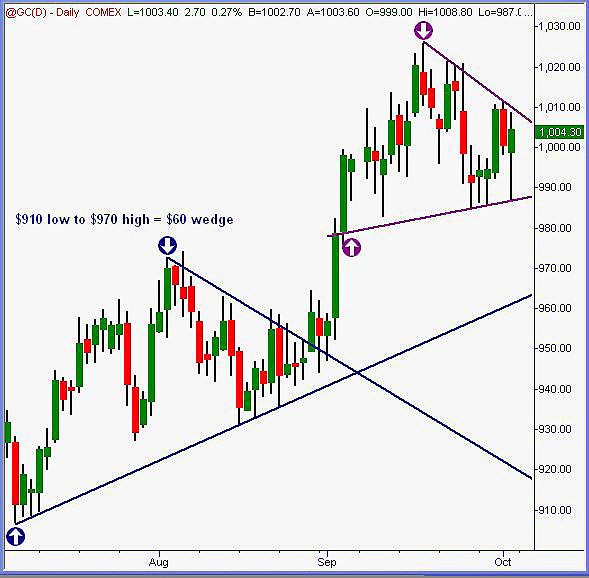
| From July through August this year, gold wedged itself into a crisp apex pattern. A wedge low near 910 and high near 970, or a $60 span, predicted that far of a push away from the pattern, whichever way it inevitably broke; 950 breakout + $60 projection from there = $1,010 price objective to target. See Figure 1. |

|
| FIGURE 2: GC, WEEKLY |
| Graphic provided by: TradeStation. |
| |
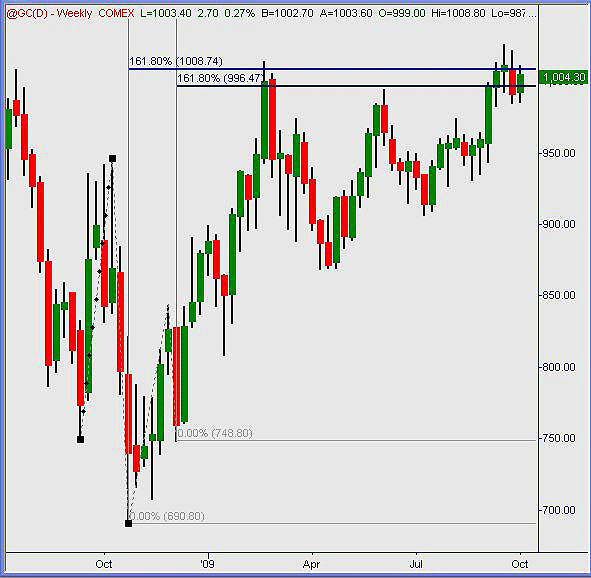
| One year ago, $700 per ounce lows gyrated to current high levels in a staccato fashion. We couldn't even accuse gold futures of being deliberate or methodical in this chart. Wide valuation swings up and down eventually made way to where it is now. Where it is now happens to be at layered 1-2-3 swing projection targets from two of the major historical waves. That's where the current wedging finds itself magnetized to for now. See Figure 2. |

|
| FIGURE 3: GC, DAILY |
| Graphic provided by: TradeStation. |
| |
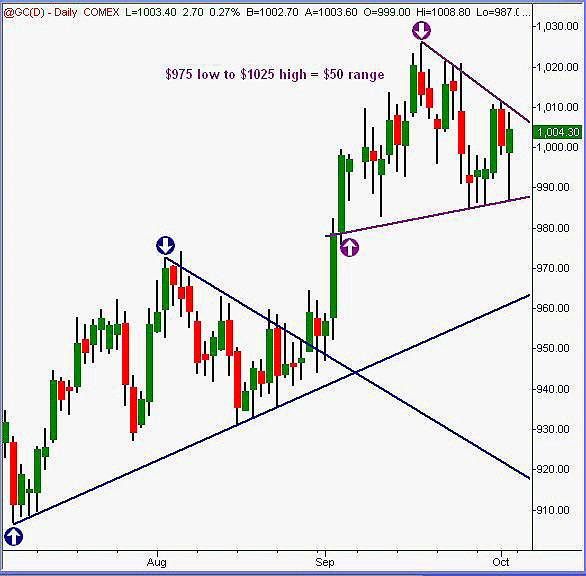
| That recent wedge pattern has a low–high span of $50 at its width (Figure 3). You know the drill by now: breakout pending from 1010 points toward 1060 while a similar breakdown near 990 points toward 940 objectives. One or the other is probable, sooner or later. |
| Gold prices reflect a fear of inflation to come. There was a time not long ago when $1,000 an oz. seemed unlikely to some. Perhaps even now, $2,000 an oz. seems equally incredulous. That type of speculation is merely that — idle speculation. What we can do is measure price direction one chunk at a time. Next chunk should be rather direct, $50 higher or lower. Time will tell. It always does. |
Austin is a private trader who trades emini stock index futures intraday. He currently trades various futures markets from home in addition to managing a trader's educational forum
| Title: | Individual Trader |
| Company: | CoiledMarkets.com |
| Address: | PO Box 633 |
| Naples, NY 14512 | |
| Website: | coiledmarkets.com/blog |
| E-mail address: | austinp44@yahoo.com |
Traders' Resource Links | |
| CoiledMarkets.com has not added any product or service information to TRADERS' RESOURCE. | |
Click here for more information about our publications!
Comments
Date: 10/07/09Rank: 5Comment:

Request Information From Our Sponsors
- StockCharts.com, Inc.
- Candle Patterns
- Candlestick Charting Explained
- Intermarket Technical Analysis
- John Murphy on Chart Analysis
- John Murphy's Chart Pattern Recognition
- John Murphy's Market Message
- MurphyExplainsMarketAnalysis-Intermarket Analysis
- MurphyExplainsMarketAnalysis-Visual Analysis
- StockCharts.com
- Technical Analysis of the Financial Markets
- The Visual Investor
- VectorVest, Inc.
- Executive Premier Workshop
- One-Day Options Course
- OptionsPro
- Retirement Income Workshop
- Sure-Fire Trading Systems (VectorVest, Inc.)
- Trading as a Business Workshop
- VectorVest 7 EOD
- VectorVest 7 RealTime/IntraDay
- VectorVest AutoTester
- VectorVest Educational Services
- VectorVest OnLine
- VectorVest Options Analyzer
- VectorVest ProGraphics v6.0
- VectorVest ProTrader 7
- VectorVest RealTime Derby Tool
- VectorVest Simulator
- VectorVest Variator
- VectorVest Watchdog
