HOT TOPICS LIST
- MACD
- Fibonacci
- RSI
- Gann
- ADXR
- Stochastics
- Volume
- Triangles
- Futures
- Cycles
- Volatility
- ZIGZAG
- MESA
- Retracement
- Aroon
INDICATORS LIST
LIST OF TOPICS
PRINT THIS ARTICLE
by Austin Passamonte
Short- and medium-term outlook for the US Dollar Index.
Position: N/A
Austin Passamonte
Austin is a private trader who trades emini stock index futures intraday. He currently trades various futures markets from home in addition to managing a trader's educational forum
PRINT THIS ARTICLE
TECHNICAL ANALYSIS
Dollar Dance
10/05/09 09:50:21 AMby Austin Passamonte
Short- and medium-term outlook for the US Dollar Index.
Position: N/A
| More so this year than any other in recent memory, the USD index wags every financial market tail in rythmic fashion. Stocks, commodities, and currencies... they're all doing the dollar dance. |

|
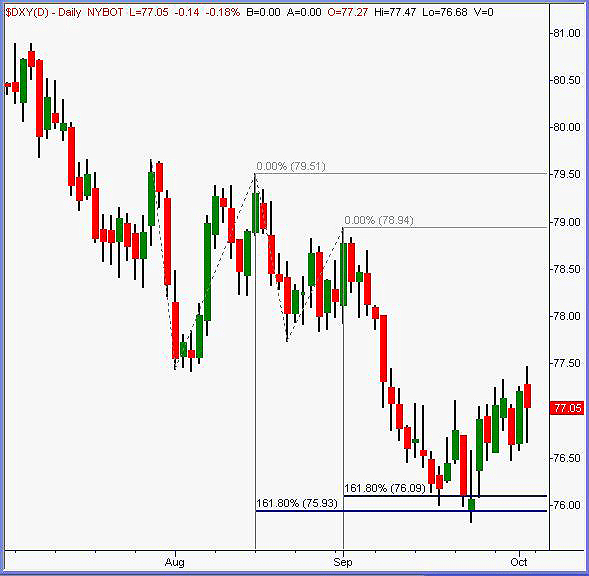
| FIGURE 1: DXY, DAILY |
| Graphic provided by: TradeStation. |
| |
| Starting with a daily chart of the DXY (Figure 1) shows where two recent 1-2-3 swings measured by Fibonacci projections both overlap initial objectives near the 76 level. After trading one session (Wednesday, September 23) inside that zone, the subsequent seven days forward marked the peak in stocks and current pullback there. Likewise, commodity markets are in lockstep accordingly. |

|
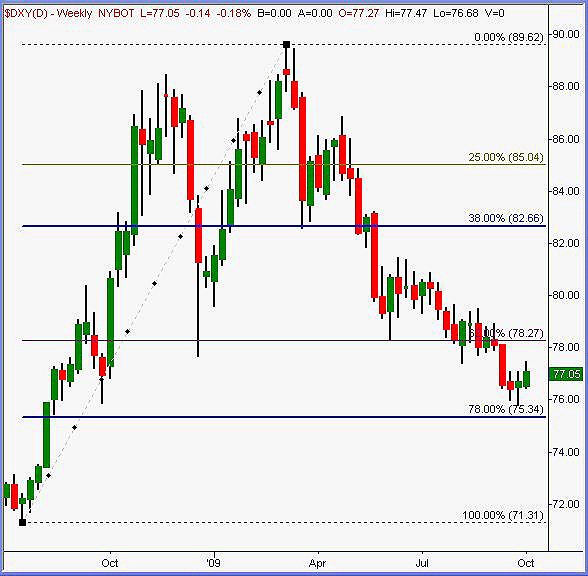
| FIGURE 2: DXY, WEEKLY |
| Graphic provided by: TradeStation. |
| |
| The weekly chart (Figure 2) shows where the USD paused at 38% value twice, stepped its way down to 62% where it bounced once and wedged twice. Wedge break there has it headed toward the 78% level, with multiple layers of congestion right around there. |

|
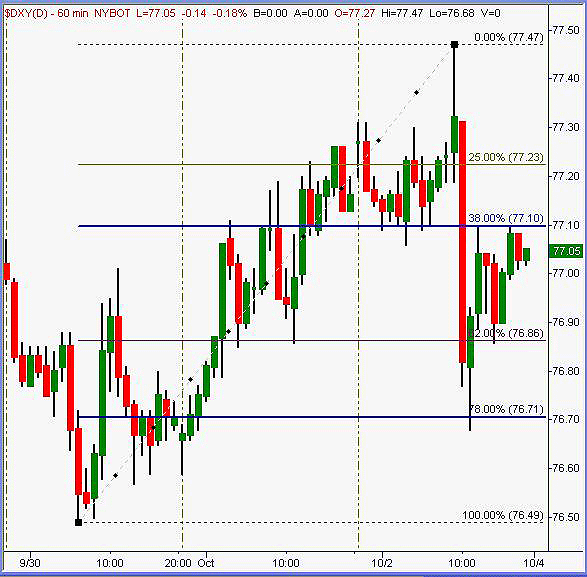
| FIGURE 3: DXY, 60-MINUTE |
| Graphic provided by: TradeStation. |
| |
| An inside look at the 60-minute chart (Figure 3) outlines the Friday reaction to nonfarm payroll and other economic reports. Low-high swing from September 30 through October 2 contained price action between actionable levels. It's pretty much a 1.00 range from 76.50 to 77.50 for what comes next. Further break lower marks a bottom for stocks and upward ascent renewed. Should the DXY pop back above 77.50 on its way to parts unknown, stocks will only go one way from there: straight south. |
| Like a peacock's tailfeathers, DXY fans out through all financial markets in rippled fashion. Until stocks return to moving up or down based on earnings, mergers and price/earnings ratios instead of doing the dollar dance, we'd better keep our eyes on the DXY for lead-proxy clues. |
Austin is a private trader who trades emini stock index futures intraday. He currently trades various futures markets from home in addition to managing a trader's educational forum
| Title: | Individual Trader |
| Company: | CoiledMarkets.com |
| Address: | PO Box 633 |
| Naples, NY 14512 | |
| Website: | coiledmarkets.com/blog |
| E-mail address: | austinp44@yahoo.com |
Traders' Resource Links | |
| CoiledMarkets.com has not added any product or service information to TRADERS' RESOURCE. | |
Click here for more information about our publications!
Comments
Date: 10/07/09Rank: 1Comment:

Request Information From Our Sponsors
- StockCharts.com, Inc.
- Candle Patterns
- Candlestick Charting Explained
- Intermarket Technical Analysis
- John Murphy on Chart Analysis
- John Murphy's Chart Pattern Recognition
- John Murphy's Market Message
- MurphyExplainsMarketAnalysis-Intermarket Analysis
- MurphyExplainsMarketAnalysis-Visual Analysis
- StockCharts.com
- Technical Analysis of the Financial Markets
- The Visual Investor
- VectorVest, Inc.
- Executive Premier Workshop
- One-Day Options Course
- OptionsPro
- Retirement Income Workshop
- Sure-Fire Trading Systems (VectorVest, Inc.)
- Trading as a Business Workshop
- VectorVest 7 EOD
- VectorVest 7 RealTime/IntraDay
- VectorVest AutoTester
- VectorVest Educational Services
- VectorVest OnLine
- VectorVest Options Analyzer
- VectorVest ProGraphics v6.0
- VectorVest ProTrader 7
- VectorVest RealTime Derby Tool
- VectorVest Simulator
- VectorVest Variator
- VectorVest Watchdog
