HOT TOPICS LIST
- MACD
- Fibonacci
- RSI
- Gann
- ADXR
- Stochastics
- Volume
- Triangles
- Futures
- Cycles
- Volatility
- ZIGZAG
- MESA
- Retracement
- Aroon
INDICATORS LIST
LIST OF TOPICS
PRINT THIS ARTICLE
by Austin Passamonte
Near- to medium-term outlook for the S&P 500.
Position: N/A
Austin Passamonte
Austin is a private trader who trades emini stock index futures intraday. He currently trades various futures markets from home in addition to managing a trader's educational forum
PRINT THIS ARTICLE
TECHNICAL ANALYSIS
Bull-Stalled
10/05/09 02:11:41 PMby Austin Passamonte
Near- to medium-term outlook for the S&P 500.
Position: N/A
| In early March the stock index markets were given up for dead... right about when they launched for the current months-long rally mode. ES found itself +400 index points higher than those March lows, albeit on the cusp of pullback mode. Recent sentiment has shifted, and volume accelerated noticeably as price turned from resistance and sought out the next support below. Has there been a garden-variety pullback to stage a year-end rally, or has the year-long rally ended already? |

|
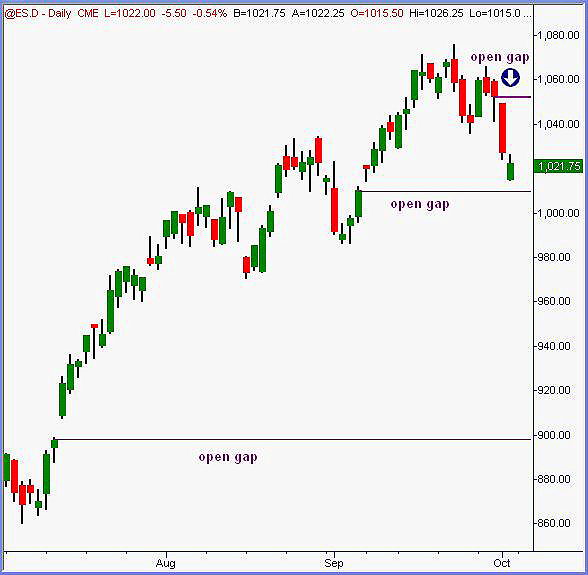
| FIGURE 1: ES, DAILY |
| Graphic provided by: TradeStation. |
| |
| There have been open gaps galore. The Standard & Poor's 500 futures (ES) currently has a window still open at 1053 above and 1009 below. It's slightly more than another -100 points to the remaining gap below, which turned out to be a breakway signal in early September. We cannot rule out a price pullback to that level, which would still leave the current overall uptrend intact, should it happen. It is roughly a 50% retracement from March lows to recent highs at that mark. |

|
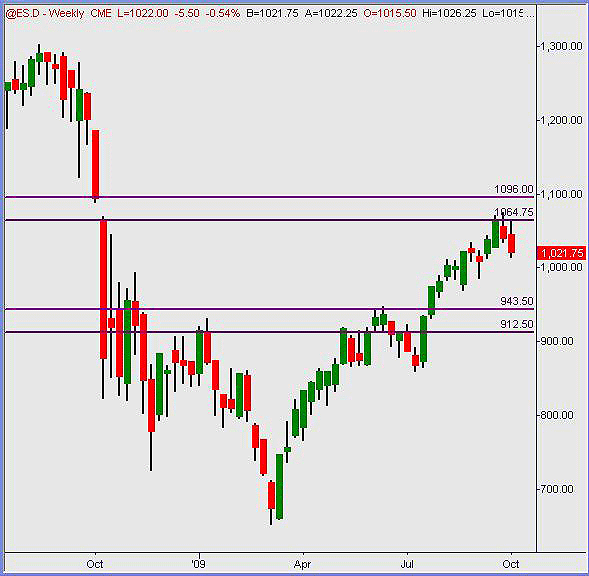
| FIGURE 2: ES, WEEKLY |
| Graphic provided by: TradeStation. |
| |
| We can see where last October's open gap has become a rejection point on the initial test last week. Price needs to climb into that channel and turn current resistance into support; the 1060+ level probed again will either be rejected straightaway and head to considerably lower lows, or give way to further rallying toward the venerable 1100 handle. |

|
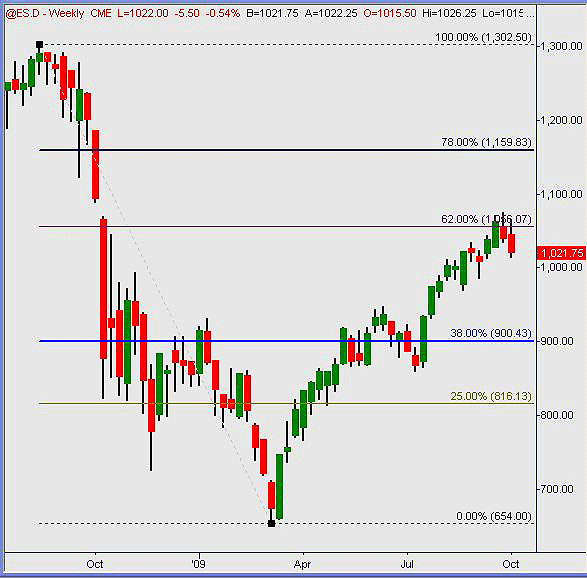
| FIGURE 3: ES, WEEKLY |
| Graphic provided by: TradeStation. |
| |
| Measuring a retracement bracket from September 2008 swing high to March 2009 swing low gives a 62% retracement zone near the ES 1056 mark. That technical level would be expected to have sell-stop orders resting nearby to probe a reversal failure potential. And it was, for the moment. The first test of any level is usually reflexive; what comes next remains to be seen. A push through 1060 sustained would make the next target 1100 and then the 1150 zone above. |
| The gap at the open at 1009 should fill this week ahead, and perhaps a gap above at 1053, too. Which way next depends on the 1000 level holding for sustained bounce on strong volume, and/or break above the 1060s layered congestion in similar fashion. Above 1060s or below 1000 should see sustained moves continued from there. |
Austin is a private trader who trades emini stock index futures intraday. He currently trades various futures markets from home in addition to managing a trader's educational forum
| Title: | Individual Trader |
| Company: | CoiledMarkets.com |
| Address: | PO Box 633 |
| Naples, NY 14512 | |
| Website: | coiledmarkets.com/blog |
| E-mail address: | austinp44@yahoo.com |
Traders' Resource Links | |
| CoiledMarkets.com has not added any product or service information to TRADERS' RESOURCE. | |
Click here for more information about our publications!
Comments
Date: 10/07/09Rank: 5Comment:

Request Information From Our Sponsors
- VectorVest, Inc.
- Executive Premier Workshop
- One-Day Options Course
- OptionsPro
- Retirement Income Workshop
- Sure-Fire Trading Systems (VectorVest, Inc.)
- Trading as a Business Workshop
- VectorVest 7 EOD
- VectorVest 7 RealTime/IntraDay
- VectorVest AutoTester
- VectorVest Educational Services
- VectorVest OnLine
- VectorVest Options Analyzer
- VectorVest ProGraphics v6.0
- VectorVest ProTrader 7
- VectorVest RealTime Derby Tool
- VectorVest Simulator
- VectorVest Variator
- VectorVest Watchdog
- StockCharts.com, Inc.
- Candle Patterns
- Candlestick Charting Explained
- Intermarket Technical Analysis
- John Murphy on Chart Analysis
- John Murphy's Chart Pattern Recognition
- John Murphy's Market Message
- MurphyExplainsMarketAnalysis-Intermarket Analysis
- MurphyExplainsMarketAnalysis-Visual Analysis
- StockCharts.com
- Technical Analysis of the Financial Markets
- The Visual Investor
