HOT TOPICS LIST
- MACD
- Fibonacci
- RSI
- Gann
- ADXR
- Stochastics
- Volume
- Triangles
- Futures
- Cycles
- Volatility
- ZIGZAG
- MESA
- Retracement
- Aroon
INDICATORS LIST
LIST OF TOPICS
PRINT THIS ARTICLE
by Donald W. Pendergast, Jr.
With 17% of the S&P 500 component stocks flashing new RMO swing sell signals, there can be little doubt that the broad US markets have put in a significant weekly high.
Position: Sell
Donald W. Pendergast, Jr.
Donald W. Pendergast is a financial markets consultant who offers specialized services to stock brokers and high net worth individuals who seek a better bottom line for their portfolios.
PRINT THIS ARTICLE
TRADING SYSTEMS
With RMO Sell Signals, Current Selloff To Continue
10/02/09 09:12:45 AMby Donald W. Pendergast, Jr.
With 17% of the S&P 500 component stocks flashing new RMO swing sell signals, there can be little doubt that the broad US markets have put in a significant weekly high.
Position: Sell
| Some traders and investors saw the mammoth selloff of October 1 coming, while others didn't. Whether or not you were anticipating a significant turn, the fact remains that the markets have just put in a weekly cycle high that should remain in place for at least the next seven to 10 weeks, assuming that the bullish quarterly price cycles driving the Standard & Poor's 500 and Russell 2000 indexes will continue to remain in long-term bullish mode. We'll examine the broad-based nature of today's plunge first, investigate the long-term (six-year) market cycle and where we are currently within it and then take a look at a large-cap NASDAQ/S&P 500 component stock that may provide us with a low-risk trade opportunity. |

|
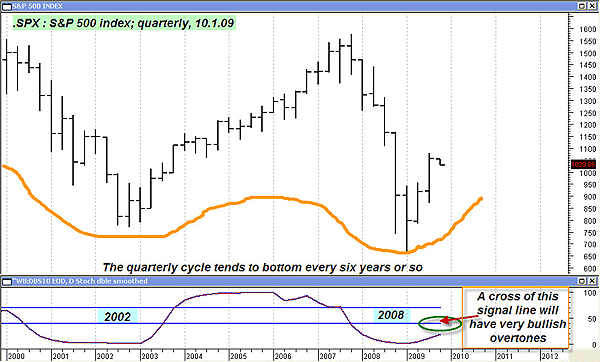
| FIGURE 1: SPX, QUARTERLY. When short-term selloffs happen, sometimes it pays to take a step back and put everything into perspective. The current quarterly cycle (the six-year cycle) in the .SPX is still rising, and a cross above the lower signal line (green oval) will be especially bullish. |
| Graphic provided by: MetaStock. |
| Graphic provided by: WB DBS10 EOD from ProfitTrader for MetaStock. |
| |
| To prepare for this article, I ran both the Russell 2000 and S&P 500 component stocks through MetaStock's RMO Swing Trade Sell exploration and determined that 13% (almost 260) of the Russell 2000 stocks and more than 17% of the S&P 500 stocks (87 stocks) have produced RMO (Rahul Mohindar oscillator) swing sell trade signals. This is the largest quantity of such signals since earlier this year, prior to the March 2009 reversal. This provides more evidence that the anticipated weekly cycle highs in the R2K and SPX are now firmly in place, and that the broad market's direction is likely to be down, at least into the next weekly cycle low, currently due around mid-November 2009. In the meantime, R2K and SPX should make daily cycle lows on or around October 7–12, 2009. What this means is that very nimble daily based and intraday traders may find numerous setups on either side of the market (long and short) over the next six weeks or so; they need to be aware of that heavy downward pull of the weekly cycle, however, and to move in and out of short-term positions on very short notice. There is reason for long-term bulls to remain optimistic despite the likelihood of increased turbulence in the coming weeks, and that's because the long-term (quarterly) price cycles in both indexes remains in bullish configuration. And with the economy finally showing some signs of recovery, it shouldn't be too hard for the big institutions to keep putting money to work as long as those cycles are pointing upward. In the .SPX quarterly chart depicted in Figure 1, you can get a better idea of the big market picture and see just how potentially bullish the next few years might be for the broad US market indexes. We may not see a run like the one we had from 2003–07, but if we get even two-thirds of that, there should still be plenty of upside remaining, and once we get past November's weekly cycle low, a solid year-end rally is very likely to materialize. Right now, though, let's wallow in some doom and gloom as we figure out how to make some money off of this developing selloff. |

|
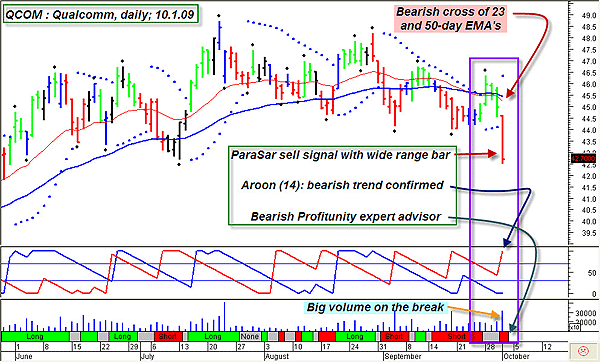
| FIGURE 2: QCOM, DAILY. It's not a good time to go long QCOM, however, at least not on a short-term basis. Waiting for a minor daily bounce may allow out-of-the-money call option sellers to command greater premiums. |
| Graphic provided by: MetaStock. |
| Graphic provided by: Profitunity - MetaStock expert advisor. |
| |
| Figure 2 is the daily chart for Qualcomm (QCOM), a name that most traders and investors have become familiar with since the late 1990s. QCOM not only has produced a new ParaSar sell signal (on heavy volume and with wide range), but the signal has arrived even as a bearish cross of the 23- and 50-period exponential moving averages (EMAs) has occurred and the Aroon (14) indicator has swung sharply to the bearish side of its range. Last, but not least, the Profitunity (Bill Williams) MetaStock expert advisor is also flashing a "short" alert (red ribbon at bottom of chart). The last time (September 2008) that QCOM made a bearish cross of the daily 23/50 EMAs, it proceeded to lose about 40%, but don't look for anything so dramatic this time (remember, the bullish six-year cycle is still driving this market). Expect a more orderly drop, first down to major support near $39.85 and then perhaps down toward $37.32. QCOM is fairly well correlated (about 0.75 to 0.90) to the big moves in the .SPX, .NDX, and .RUT, so look for it to bottom out sometime in November, along with the rest of the broad market, unless there are earnings issues or other corporate tremors afoot between now and then. Now, here's an option play for the more adventurous among those in the viewing audience (Figure 3). |

|
| FIGURE 3: QCOM CREDIT SPREAD. Waiting for QCOM to bounce back to $44.30 may allow November $47/$50 credit spread sellers to earn an additional $0.23 more in premiums per spread — $0.65 vs. $0.42. |
| Graphic provided by: ThinkorSwim. |
| |
| I don't like to buy options, and I certainly wouldn't recommend the purchase of puts here, but selling a credit spread on a mild recovery bounce in QCOM over the next few sessions, well, I like that idea just fine, and here's why. QCOM is in a confirmed bear phase, with at least three heavy-duty resistance barriers separating it from the lower strike of the credit spread I'm going to recommend, but given the big range of Thursday's selloff, let's see if QCOM doesn't bounce higher by a dollar or two before it starts to head south again. That way, we can collect more money on a spread that has an exceptionally high probability of expiring worthless between now and November's option expiration on 11/20/09. Here's the trade setup — remember, we'll only get these credit amounts if the stock bounces a bit higher in the next few sessions: Sell 1 November 2009 QCOM $47 call option (AAOKM) Buy 1 November 2009 QCOM $50 call option (AAOKJ) -------------------------------------------------- Net credit received: $0.65 or better ($65 in dollar terms) QCOM has the 50-period EMA now acting as resistance (about $45.40), and just above that two daily swing highs at $46.35 and $46.75, respectively. For QCOM to hit the short option strike at $47, it has to take out all three of these resistances, and that isn't too likely between now and November options expiration, given all of the technicals already discussed. The hardest part of this trade is waiting for the anticipated daily bounce to occur, this allowing collection of at least $0.65 per spread sold. If you can get filled at $0.65 or better, simply keep an eye on those three resistance areas as the trade progresses. Close the trade if the price of the spread doubles or if an unusually strong reversal sees QCOM close above $47.00 before options expiry. If all goes as anticipated, QCOM should fall like a stone after a mild bounce higher, taking it down toward at least $39.85, the first major support. That could be an excellent time to take partial profits, closing out a portion of the trade (if you sell multiple spreads) and letting the balance of your positions ride for as long as QCOM and the broad markets continue their projected declines. If in doubt, and you can buy the spread back for only 25–30% of what you received in initial credit, feel free to do so, walking away with relatively stress-free gains. When trading options and spreads, many times your first solid gain is your best gain, and you should be happy and take it without complaining. |
Donald W. Pendergast is a financial markets consultant who offers specialized services to stock brokers and high net worth individuals who seek a better bottom line for their portfolios.
| Title: | Writer, market consultant |
| Company: | Linear Trading Systems LLC |
| Jacksonville, FL 32217 | |
| Phone # for sales: | 904-239-9564 |
| E-mail address: | lineartradingsys@gmail.com |
Traders' Resource Links | |
| Linear Trading Systems LLC has not added any product or service information to TRADERS' RESOURCE. | |
Click here for more information about our publications!
Comments
Date: 10/02/09Rank: 2Comment:

Request Information From Our Sponsors
- VectorVest, Inc.
- Executive Premier Workshop
- One-Day Options Course
- OptionsPro
- Retirement Income Workshop
- Sure-Fire Trading Systems (VectorVest, Inc.)
- Trading as a Business Workshop
- VectorVest 7 EOD
- VectorVest 7 RealTime/IntraDay
- VectorVest AutoTester
- VectorVest Educational Services
- VectorVest OnLine
- VectorVest Options Analyzer
- VectorVest ProGraphics v6.0
- VectorVest ProTrader 7
- VectorVest RealTime Derby Tool
- VectorVest Simulator
- VectorVest Variator
- VectorVest Watchdog
- StockCharts.com, Inc.
- Candle Patterns
- Candlestick Charting Explained
- Intermarket Technical Analysis
- John Murphy on Chart Analysis
- John Murphy's Chart Pattern Recognition
- John Murphy's Market Message
- MurphyExplainsMarketAnalysis-Intermarket Analysis
- MurphyExplainsMarketAnalysis-Visual Analysis
- StockCharts.com
- Technical Analysis of the Financial Markets
- The Visual Investor
