HOT TOPICS LIST
- MACD
- Fibonacci
- RSI
- Gann
- ADXR
- Stochastics
- Volume
- Triangles
- Futures
- Cycles
- Volatility
- ZIGZAG
- MESA
- Retracement
- Aroon
INDICATORS LIST
LIST OF TOPICS
PRINT THIS ARTICLE
by Donald W. Pendergast, Jr.
Penny stocks are among the most volatile of all, but for the patient and wise, substantial gains are possible. Here's a fascinating setup in a Canadian precious metals stock.
Position: N/A
Donald W. Pendergast, Jr.
Donald W. Pendergast is a financial markets consultant who offers specialized services to stock brokers and high net worth individuals who seek a better bottom line for their portfolios.
PRINT THIS ARTICLE
FLAGS AND PENNANTS
SCM.V Ready To Break From Bull Flag?
10/01/09 10:59:45 AMby Donald W. Pendergast, Jr.
Penny stocks are among the most volatile of all, but for the patient and wise, substantial gains are possible. Here's a fascinating setup in a Canadian precious metals stock.
Position: N/A
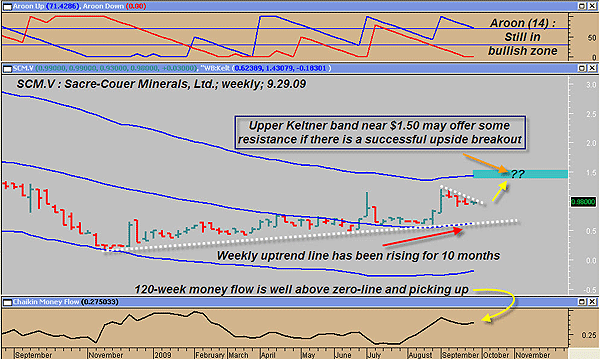
| Sacre-Coeur Minerals, Ltd. (SCM.V, TSX), is an exploration and development company, one focused on finding gold and diamond deposits in Guyana. Its share price shows definite signs of long-term accumulation and, even better, its daily chart is presenting speculative traders with a well-formed and potentially explosive bull flag pattern. First, take a look at SCM's weekly chart to get a long-term perspective (Figure 1). |

|
| FIGURE 1: SCM, WEEKLY. Any stock with a 10-month-old rising trendline should be assumed to be in a major trend, all else being equal. |
| Graphic provided by: MetaStock. |
| Graphic provided by: WB Keltner Channels EOD from ProfitTrader. |
| |
| Generally speaking, this stock appears to be telegraphing its long-term intentions well beforehand; even though it's a penny stock, any stock with a steadily rising, 10-month-old rising trendline in place deserves a second look. The Chaikin money flow is also very healthy and also looks to be in sympathy with the current uptrend. Last but not least, the Aroon (14) trend intensity indicator (top panel) is still in bullish mode and will be as long as it remains above 70. Note the fascinating transition the stock traces out as it moves from one Keltner band to the next. This stock has a ton of support near the confluence of the uptrend line and the Keltner midline near $0.65 to $0.70. |

|
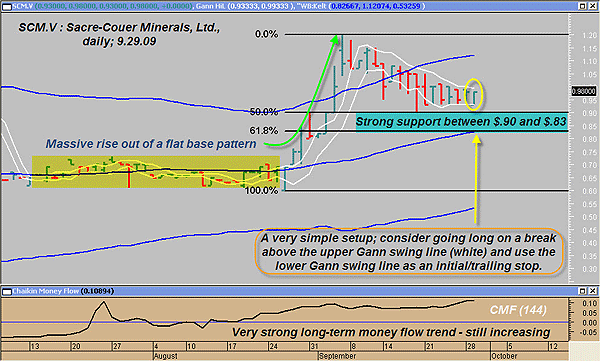
| FIGURE 2: SCM, DAILY. Essentially, this looks like a classic case of a pullback entry setup, one coming in the aftermath of a massive flat-base breakout pattern. The Gann swing lines offer a simple way to enter/exit various kinds of breakout trade setups. |
| Graphic provided by: MetaStock. |
| Graphic provided by: WB Keltner Channels EOD from ProfitTrader. |
| |
| Sacre-Coeur's daily chart (Figure 2) allows us a closer look at the beautiful bull flag/pennant, one from which Sacre may be ready to break from in the next week or two. I've overlaid the Gann swing lines (white bands surrounding prices) on the chart, and sometimes these can work very effectively in breakout situations like this one. Since we already know that the long-term trend bias in the stock is up, a daily close above the upper Gann swing line could be the tipoff that the stock is going to break strongly higher. By using the lower Gann swing line as your initial stop and/or trailing stop, your dollar risk should be very modest should the breakout fail. The stock also has good chart and Fibonacci support just below the flag, all the way down to $0.83, so any breaks lower may find some meaningful support at those levels. If you do get filled on a break higher, consider trailing the move with the lower Gann swing line, which is a simple three-period moving average of the lows. If a breakout manages to make it up toward $1.20 (September's swing high), consider booking half-profits and letting the rest ride with a two- to three-bar trailing stop of the lows. |
| Overall, this setup in SCM.V looks like it has excellent risk-to-reward potential. With such a strong weekly uptrend already in place, any breaks to the upside should be treated as a genuine opportunity for profit. |
Donald W. Pendergast is a financial markets consultant who offers specialized services to stock brokers and high net worth individuals who seek a better bottom line for their portfolios.
| Title: | Writer, market consultant |
| Company: | Linear Trading Systems LLC |
| Jacksonville, FL 32217 | |
| Phone # for sales: | 904-239-9564 |
| E-mail address: | lineartradingsys@gmail.com |
Traders' Resource Links | |
| Linear Trading Systems LLC has not added any product or service information to TRADERS' RESOURCE. | |
Click here for more information about our publications!
Comments
Date: 10/02/09Rank: 1Comment:
Date: 05/28/18Rank: 4Comment:

Request Information From Our Sponsors
- VectorVest, Inc.
- Executive Premier Workshop
- One-Day Options Course
- OptionsPro
- Retirement Income Workshop
- Sure-Fire Trading Systems (VectorVest, Inc.)
- Trading as a Business Workshop
- VectorVest 7 EOD
- VectorVest 7 RealTime/IntraDay
- VectorVest AutoTester
- VectorVest Educational Services
- VectorVest OnLine
- VectorVest Options Analyzer
- VectorVest ProGraphics v6.0
- VectorVest ProTrader 7
- VectorVest RealTime Derby Tool
- VectorVest Simulator
- VectorVest Variator
- VectorVest Watchdog
- StockCharts.com, Inc.
- Candle Patterns
- Candlestick Charting Explained
- Intermarket Technical Analysis
- John Murphy on Chart Analysis
- John Murphy's Chart Pattern Recognition
- John Murphy's Market Message
- MurphyExplainsMarketAnalysis-Intermarket Analysis
- MurphyExplainsMarketAnalysis-Visual Analysis
- StockCharts.com
- Technical Analysis of the Financial Markets
- The Visual Investor
