HOT TOPICS LIST
- MACD
- Fibonacci
- RSI
- Gann
- ADXR
- Stochastics
- Volume
- Triangles
- Futures
- Cycles
- Volatility
- ZIGZAG
- MESA
- Retracement
- Aroon
INDICATORS LIST
LIST OF TOPICS
PRINT THIS ARTICLE
by Mike Carr, CMT
This indicator is rarely used but can provide valuable insights.
Position: N/A
Mike Carr, CMT
Mike Carr, CMT, is a member of the Market Technicians Association, and editor of the MTA's newsletter, Technically Speaking. He is also the author of "Smarter Investing in Any Economy: The Definitive Guide to Relative Strength Investing," and "Conquering the Divide: How to Use Economic Indicators to Catch Stock Market Trends."
PRINT THIS ARTICLE
RATE CHANGE - PRICE
Rate Of Change
09/30/09 09:00:03 AMby Mike Carr, CMT
This indicator is rarely used but can provide valuable insights.
Position: N/A
| Most traders fail to examine what the indicator known as the rate of change really is, which is simply the percentage change in price over a defined period. For example, to calculate the 26-week rate of change, you would subtract the price 26 weeks ago from today's price and then divide that difference by the price 26 weeks ago. |
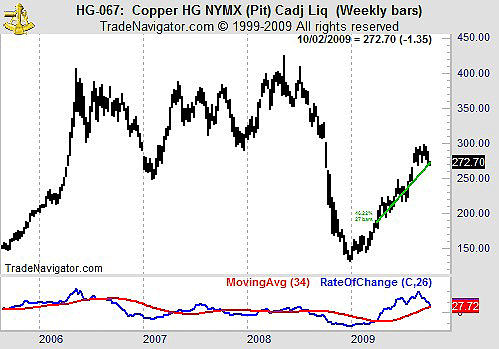
| One problem with it is that it just seems to be too simplistic to provide trading signals, and this is true. But it can be combined with a moving average and applied to trading strategies as a trend filter. This idea is shown in Figure 1. |

|
| FIGURE 1: COPPER. Here's copper with the 26-week rate of change and a 34-week moving average. |
| Graphic provided by: Trade Navigator. |
| |
| In this figure, the rate of change in price is trading above its long-term moving average. A 34-week moving average is used, but there is nothing magical about that number. Waiting for the crossover to initiate a long position allows the trader to capture almost half of the move off the bottom. |
| Applying a moving average to an indicator is an overlooked technique, yet it is actually the basis of the well-known and widely followed stochastic indicator. In this case, the technique can serve as a trading signal or a trend filter as part of a more complex strategy. |
Mike Carr, CMT, is a member of the Market Technicians Association, and editor of the MTA's newsletter, Technically Speaking. He is also the author of "Smarter Investing in Any Economy: The Definitive Guide to Relative Strength Investing," and "Conquering the Divide: How to Use Economic Indicators to Catch Stock Market Trends."
| Website: | www.moneynews.com/blogs/MichaelCarr/id-73 |
| E-mail address: | marketstrategist@gmail.com |
Click here for more information about our publications!
PRINT THIS ARTICLE

Request Information From Our Sponsors
- StockCharts.com, Inc.
- Candle Patterns
- Candlestick Charting Explained
- Intermarket Technical Analysis
- John Murphy on Chart Analysis
- John Murphy's Chart Pattern Recognition
- John Murphy's Market Message
- MurphyExplainsMarketAnalysis-Intermarket Analysis
- MurphyExplainsMarketAnalysis-Visual Analysis
- StockCharts.com
- Technical Analysis of the Financial Markets
- The Visual Investor
- VectorVest, Inc.
- Executive Premier Workshop
- One-Day Options Course
- OptionsPro
- Retirement Income Workshop
- Sure-Fire Trading Systems (VectorVest, Inc.)
- Trading as a Business Workshop
- VectorVest 7 EOD
- VectorVest 7 RealTime/IntraDay
- VectorVest AutoTester
- VectorVest Educational Services
- VectorVest OnLine
- VectorVest Options Analyzer
- VectorVest ProGraphics v6.0
- VectorVest ProTrader 7
- VectorVest RealTime Derby Tool
- VectorVest Simulator
- VectorVest Variator
- VectorVest Watchdog
