HOT TOPICS LIST
- MACD
- Fibonacci
- RSI
- Gann
- ADXR
- Stochastics
- Volume
- Triangles
- Futures
- Cycles
- Volatility
- ZIGZAG
- MESA
- Retracement
- Aroon
INDICATORS LIST
LIST OF TOPICS
PRINT THIS ARTICLE
by Chaitali Mohile
The bullish breakout of Dr. Reddy's Laboratories has hit new highs. Can the stock be traded at higher levels?
Position: Buy
Chaitali Mohile
Active trader in the Indian stock markets since 2003 and a full-time writer. Trading is largely based upon technical analysis.
PRINT THIS ARTICLE
CHART ANALYSIS
Dr. Reddy's Labs At New High
09/30/09 01:24:48 PMby Chaitali Mohile
The bullish breakout of Dr. Reddy's Laboratories has hit new highs. Can the stock be traded at higher levels?
Position: Buy
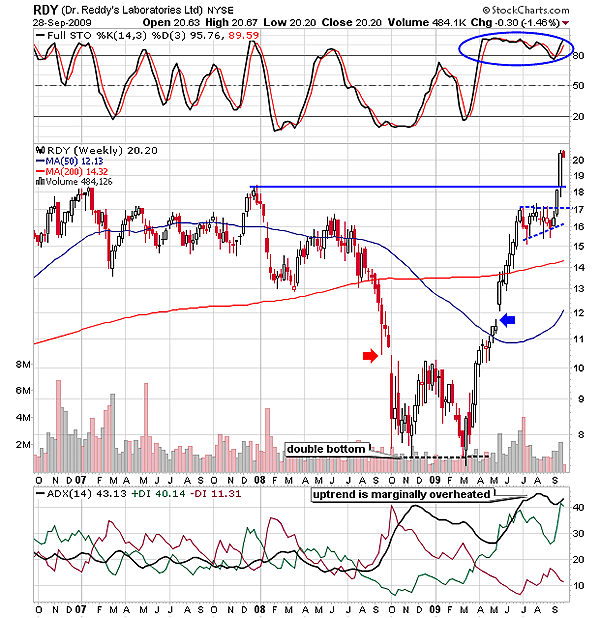
| The robust downtrend of 2007-08 dragged Dr. Reddy's Laboratories (RDY) into the single digits, losing almost 50% of its value. A double-bottom formation on the weekly time frame of RDY in Figure 1 was the first bullish reversal indication after a long bearish phase. But the double bottom formed on March 2009 inflated the new bullish hopes among traders as well as investors. The average directional movement index (ADX) (14) in Figure 1 reversed in favor of the bulls, reconfirming the bullish reversal formation on the price chart. Eventually, the upward rally that began on huge volume filled the earlier gap down (red arrow) and surged above the 50-day moving average (MA) resistance in Figure 1. The gap up above the newly formed MA support (green arrow) boosted the rally to violate another strong resistance of the 200-day MA. |

|
| FIGURE 1: RDY, WEEKLY. The bullish breakout rally has breached previous resistance. |
| Graphic provided by: StockCharts.com. |
| |
| The bullish rally consolidated in the support-resistance zone at $17 and $15. During the previous correction, RDY formed a lower peak in the same range. Therefore, it was essential to sustain the bullish force in these areas. The consolidation in the tapering range formed a bullish flag & pennant formation, suggesting stability of the current upward journey. The full stochastic (14,3,3) moved horizontally in an overbought region, indicating bullish momentum in the rally. The upward breakout of the bullish continuation pattern violated the previous high resistance at $18 and hit a 52-week high in Figure 1. During the breakout, the stochastic oscillator slipped below 80 to create more space for the fresh breakout rally. The ADX (14) turned marginally overheated as the uptrend moved above the 40 levels. However, no bearish indications are reflected in Figure 1; both indicators are healthily bullish, able to continue the breakout rally. |
| Hence, RDY is likely to sustain at its all-time high. Traders can look for new buying opportunities with the medium-term target of $23. The minimum estimated level on the bullish flag & pennant breakout is calculated by measuring the length of the flag pole (advance rally) and adding it to the breakout point. Therefore, considering the advance rally after the gap up, the target measured would be 17 - 12 = 5 + 18 = 23. |

|
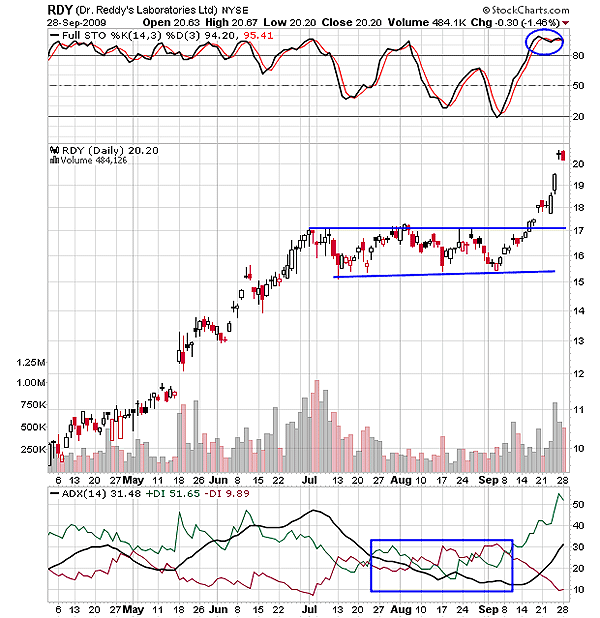
| FIGURE 2: RDY, DAILY. The consolidation range of RDY broke upward with the gap up followed by another gap up within the rally. |
| Graphic provided by: StockCharts.com. |
| |
| In Figure 2 we can also see the bullish flag & pennant pattern with an upward breakout. The daily time frame shows an accurate consolidation range of $17 and $15. According to Figure 2, RDY gapped up twice, once during the bullish breakout and later above $19. The ADX (14) is indicating the developed uptrend and full stochastic (14,3,3) is overbought above 80. The momentum indicator can remain overbought for longer periods without harming the existing bullish rally. Therefore, RDY could soon reach the estimated target of $23 with robust bullish strength. |
| To conclude, RDY continues to remain one of the reliable stocks to trade at the current higher levels. |
Active trader in the Indian stock markets since 2003 and a full-time writer. Trading is largely based upon technical analysis.
| Company: | Independent |
| Address: | C1/3 Parth Indraprasth Towers. Vastrapur |
| Ahmedabad, Guj 380015 | |
| E-mail address: | chaitalimohile@yahoo.co.in |
Traders' Resource Links | |
| Independent has not added any product or service information to TRADERS' RESOURCE. | |
Click here for more information about our publications!
PRINT THIS ARTICLE

Request Information From Our Sponsors
- VectorVest, Inc.
- Executive Premier Workshop
- One-Day Options Course
- OptionsPro
- Retirement Income Workshop
- Sure-Fire Trading Systems (VectorVest, Inc.)
- Trading as a Business Workshop
- VectorVest 7 EOD
- VectorVest 7 RealTime/IntraDay
- VectorVest AutoTester
- VectorVest Educational Services
- VectorVest OnLine
- VectorVest Options Analyzer
- VectorVest ProGraphics v6.0
- VectorVest ProTrader 7
- VectorVest RealTime Derby Tool
- VectorVest Simulator
- VectorVest Variator
- VectorVest Watchdog
- StockCharts.com, Inc.
- Candle Patterns
- Candlestick Charting Explained
- Intermarket Technical Analysis
- John Murphy on Chart Analysis
- John Murphy's Chart Pattern Recognition
- John Murphy's Market Message
- MurphyExplainsMarketAnalysis-Intermarket Analysis
- MurphyExplainsMarketAnalysis-Visual Analysis
- StockCharts.com
- Technical Analysis of the Financial Markets
- The Visual Investor
