HOT TOPICS LIST
- MACD
- Fibonacci
- RSI
- Gann
- ADXR
- Stochastics
- Volume
- Triangles
- Futures
- Cycles
- Volatility
- ZIGZAG
- MESA
- Retracement
- Aroon
INDICATORS LIST
LIST OF TOPICS
PRINT THIS ARTICLE
by Donald W. Pendergast, Jr.
The entire technology sector has been near the top of the list in terms of relative strength for some time now. Here's a short-term swing trade buy signal for one of the biggest names in the semiconductor fabrication business.
Position: Buy
Donald W. Pendergast, Jr.
Donald W. Pendergast is a financial markets consultant who offers specialized services to stock brokers and high net worth individuals who seek a better bottom line for their portfolios.
PRINT THIS ARTICLE
TRADING SYSTEMS
KLA-Tencor Short-Term Mechanical Buy Signal
09/29/09 09:11:46 AMby Donald W. Pendergast, Jr.
The entire technology sector has been near the top of the list in terms of relative strength for some time now. Here's a short-term swing trade buy signal for one of the biggest names in the semiconductor fabrication business.
Position: Buy
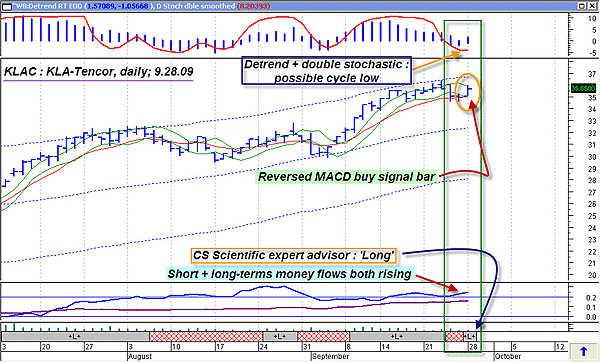
| Even though the broad markets are likely to head lower during the next month or two, I still have to acknowledge a great, low-risk bullish setup when I see it. Some stocks actually buck the broad market trend, and KLA-Tencor (KLAC) has been chugging steadily higher for more than six months now along with the rest of the technology sector. Let's take a look at the daily chart and examine the key technicals (Figure 1). |

|
| FIGURE 1: KLAC, DAILY. Confirming a mechanical trading system's entry signals with other technicals such as money flows, trend strength, and cyclical tendencies may help system performance over the long term. |
| Graphic provided by: MetaStock. |
| Graphic provided by: WB Detrend EOD from ProfitTrader for MetaStock. |
| |
| You may have already read my STOCKS & COMMODITIES March 2009 article, "Trade System Evaluation." In it, I made a convincing case for reversing the standard moving average convergence/divergence (MACD) trading system's entry and exit triggers to create a very stable, reasonably profitable trading system, one that performs in both bull and bear markets. Well, the system has fired a buy signal today for KLAC; even better, we have several other technically confirming factors that make the decision to take a long entry here that much easier. First, note the strongly trending money flow patterns -- both short and long term -- as depicted by the Chaikin money flows (CMF) (34 and 100) at the bottom of the chart. Next, the MetaStock CS Scientific expert advisor (gray ribbon near bottom of chart) is confirming that a long entry may be the preferred course of action. At the top of the chart, the dynamic duo of the detrend oscillator (blue histogram) and the double-smoothed stochastic (red line) may be suggesting that some sort of a daily cycle low has been put in. Finally, although it's not a prerequisite to taking this trade, note how close the price is to a breakout of the Gann buy swing line (green lines surrounding the price bars). |
| Trading this system according to the basic system rules is very simple: just buy at Tuesday's open and then hold the trade until the normal MACD system (available in just about every trading software package ever created) issues a buy signal and then exit the trade at the following session's open. For extra risk control, also consider placing a stop-loss 10% below your trade entry price, just in case the trade doesn't proceed as planned. In addition, due to the real possibility of a broad market reversal to lower levels, try not to risk more than 1% (or even less, maybe 0.75%) of your trading account equity on this trade. See Figure 2. |

|
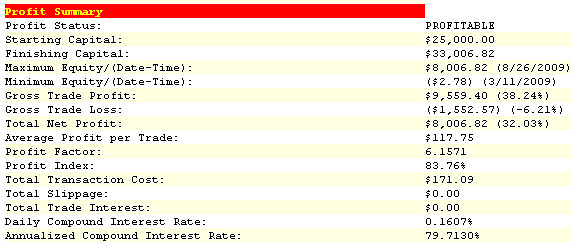
| FIGURE 2: PROFIT SUMMARY. Sometimes, the simplest trading concepts yield the best outcomes. This system simply takes the normal MACD entry and exit triggers and reverses them with very surprisingly results. |
| Graphic provided by: Compuvision's TradeSim Enterprise. |
| |
| Just for fun, here's how the reversed MACD system performed on the NASDAQ 100 component stocks from March 6, 2009, through August 26, 2009: Starting equity: $25,000 Ending equity: $33,007 Commissions: $0.008 per share, with $1 minimum per side Number of trades: 68 Wins: 51 Losses: 17 Average trade: $118 Profit factor: 6.16 Avg win to avg loss: 2.05 Maximum pct. drawdown: 2.18% Consecutive winners: 14 Consecutive losers: 4 These are impressive statistics for a long-only system, but remember that the testing period covers one of the strongest recovery rallies in US market history. Still, it's good to know that this system averages about 64-68% winning trades over a 18-year period, through two bull and two bear markets of historic proportions. |
Donald W. Pendergast is a financial markets consultant who offers specialized services to stock brokers and high net worth individuals who seek a better bottom line for their portfolios.
| Title: | Writer, market consultant |
| Company: | Linear Trading Systems LLC |
| Jacksonville, FL 32217 | |
| Phone # for sales: | 904-239-9564 |
| E-mail address: | lineartradingsys@gmail.com |
Traders' Resource Links | |
| Linear Trading Systems LLC has not added any product or service information to TRADERS' RESOURCE. | |
Click here for more information about our publications!
PRINT THIS ARTICLE

Request Information From Our Sponsors
- StockCharts.com, Inc.
- Candle Patterns
- Candlestick Charting Explained
- Intermarket Technical Analysis
- John Murphy on Chart Analysis
- John Murphy's Chart Pattern Recognition
- John Murphy's Market Message
- MurphyExplainsMarketAnalysis-Intermarket Analysis
- MurphyExplainsMarketAnalysis-Visual Analysis
- StockCharts.com
- Technical Analysis of the Financial Markets
- The Visual Investor
- VectorVest, Inc.
- Executive Premier Workshop
- One-Day Options Course
- OptionsPro
- Retirement Income Workshop
- Sure-Fire Trading Systems (VectorVest, Inc.)
- Trading as a Business Workshop
- VectorVest 7 EOD
- VectorVest 7 RealTime/IntraDay
- VectorVest AutoTester
- VectorVest Educational Services
- VectorVest OnLine
- VectorVest Options Analyzer
- VectorVest ProGraphics v6.0
- VectorVest ProTrader 7
- VectorVest RealTime Derby Tool
- VectorVest Simulator
- VectorVest Variator
- VectorVest Watchdog
