HOT TOPICS LIST
- MACD
- Fibonacci
- RSI
- Gann
- ADXR
- Stochastics
- Volume
- Triangles
- Futures
- Cycles
- Volatility
- ZIGZAG
- MESA
- Retracement
- Aroon
INDICATORS LIST
LIST OF TOPICS
PRINT THIS ARTICLE
by Donald W. Pendergast, Jr.
With the broad stock indexes having confirmed a significant medium-term top and heading lower, now is a good time to scan for stocks that are breaking lower. Here's a possible short play on an S&P 500 component.
Position: Sell
Donald W. Pendergast, Jr.
Donald W. Pendergast is a financial markets consultant who offers specialized services to stock brokers and high net worth individuals who seek a better bottom line for their portfolios.
PRINT THIS ARTICLE
KELTNER CHANNELS
More Flowserve Downside Likely
09/25/09 10:26:07 AMby Donald W. Pendergast, Jr.
With the broad stock indexes having confirmed a significant medium-term top and heading lower, now is a good time to scan for stocks that are breaking lower. Here's a possible short play on an S&P 500 component.
Position: Sell
| Irving, TX-based Flowserve, Inc. (FLS), manufactures a variety of modular pumps, mechanical seals, valves, valve actuators, and more. The company's shares crashed hard, along with the rest of the energy-related sector, during 2008-09, falling from the upper 140s all the way down to the mid-30s in a matter of months. Amazingly, the stock has reclaimed about 60% of those losses since November 2008 and, long term, appears to have excellent growth potential. Right now, though, FLS has reversed sharply at a confirmed daily cycle top, even as it appears to have made a weekly cycle top as well. Let's start with the weekly chart first (Figure 1) and then look at a possible trade setup on the daily chart (Figure 2). |

|
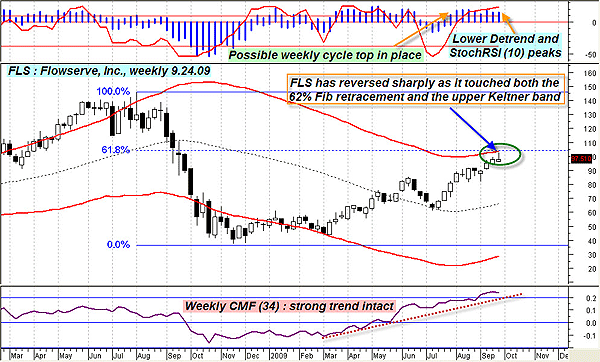
| FIGURE 1: FLS, WEEKLY. This stock makes a convincing case that it has and/or is in process of making a weekly cycle high. Note the sharp candle reversal as Fibonacci/Keltner resistances combined to keep a lid on a further rise. |
| Graphic provided by: MetaStock. |
| Graphic provided by: WB Various indicators from ProfitTrader. |
| |
| Keeping in mind that cycle analysis is as much art as it is science, the weekly chart of FLS (Figure 1) still presents a convincing case that the stock has indeed made and/or is in process of completing a weekly cycle top. The main evidence is as follows: both the detrend oscillator and the StochRSI(10) (both at the top of the chart, with the StochRSI(10) in red) have made lower highs than at previous weekly swing highs. The detrend is a great cycle-confirmation aid and does appear to have confirmed a modest price-momentum divergence. The StochRSI(10) hasn't turned lower yet but has flattened out at a lower level than on previous swings. Next, note the sharp intraweek candle reversal that occurred after FLS hit the combined resistance force of the upper Keltner band (set at 4.2 standard deviations from a 45-week exponential moving average [EMA]) and the Fibonacci 62% retracement level. Having all of this happen at the same time does suggest that the cycle high has indeed been made. However, no setup is truly perfect, and the fly in this ointment happens to be the strong money flow trend (weekly Chaikin money flow [34]), which is at the bottom of the chart. The odds still favor a weekly turn lower regardless, with the daily chart setup offering the highest probability of a sharp bearish move. That's our next job, checking out the daily chart, which is offering a very nice short setup that we'll attempt to play in a unique way. |

|
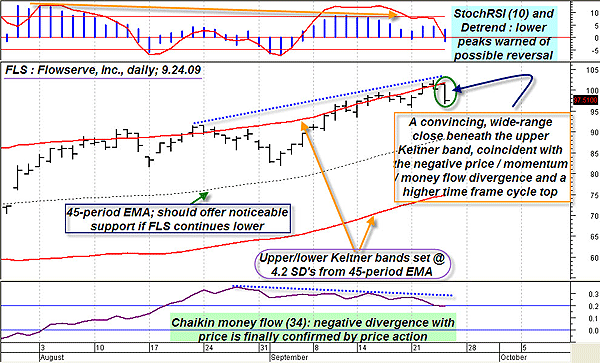
| FIGURE 2: FLS, DAILY. On this daily chart, the trend reversal is already underway; the $91-90 area may provide strong initial support. |
| Graphic provided by: MetaStock. |
| Graphic provided by: WB Various indicators from ProfitTrader. |
| |
| Figure 2 gets even more graphic, clearly presenting an image of a stock that's selling off hard as the negative price-momentum and money flow-momentum divergences have been confirmed. Note the wide-range daily reversal bar, one that occurred after the stock kept hugging the upper Keltner band, despite losing momentum at an ever-increasing rate. The Chaikin money flow (34) (bottom of chart) has been diverging from price for the last five weeks, clearly warning of this reversal lower. Finally, just as with the weekly chart, the detrend/StochRSI(10) combo (top of Figure 2) also confirmed the turn lower by way of noticeably lower highs. Note how these two dissimilar indicators help confirm cyclical highs and lows with regularity; they've certainly earned their keep on this particular setup. FLS's cyclical pattern is similar to that of the Standard & Poor's 500 and Russell 2000 indexes, and since those indexes aren't due to make a significant daily cycle low until October 10, 2009, and a major weekly cycle low until mid-November 2009, we may have a low-risk opportunity to make some money here by selling an option credit spread due to expire in November 2009. As always, the cheaper your options commissions are, the more profitable your trading results will be (Figure 3). |

|
| FIGURE 3: OPTION SPREAD. Getting paid to wait for an option spread to expire out-of-the-money may not be as much fun as winning the Irish sweepstakes, but if you do it often enough, it will never fail to bring a smile to your face. |
| Graphic provided by: ThinkorSwim FLS option spread quotes. |
| |
| The option trade I had in mind here is called a bear call spread, and here's the big idea: Sell 1 Nov 2009 $100 FLS call (FLSKT) Buy 1 Nov 2009 $105 FLS call (FLSKA) ---------------------------------------- Net credit: $1.90 or better ($190 in dollar terms) Since we expect FLS to be trading below (possibly well below) $100 per share come November 2009 options expiration (Friday, November 20, 2009), the ideal situation is to simply hold the spread until expiration, keeping all of the $190-200 net credit received for selling the spread. Time decay will slowly erode the value of both options, and as long as FLS doesn't rally sharply during the early lifespan of the trade, the spread should be in no danger of causing a significant loss. The maximum loss is calculated by taking the difference between the strikes, five points or $500, and then subtracting the credit received (hopefully $190 or more), meaning that the most we could lose is $310, no matter if FLS goes to $100, $200, or even $500 per share. Since FLS appears to have made a significant weekly cycle high and is also turning sharply lower on its daily chart after making a daily cycle high, the odds favor continued down-to-sideways movement in this stock for the next few weeks. If you see the spread value wither down to $90 or less during the first couple of weeks, consider closing out the spread and be thankful for such quick and easy gains. This means you won't need to wait for the full term of the trade in order to see profitable results, and doing so eliminates the chance that you'll be holding the spread if a powerful reversal rally (these can happen during earnings season and at key support/resistance levels) carries the stock sharply higher before November options expiration. Sometimes, when trading options, your first gain is your best gain, and you should take it without asking too many questions. Bottom line, this looks like a very low-risk, high probability bear call spread in Flowserve. |
Donald W. Pendergast is a financial markets consultant who offers specialized services to stock brokers and high net worth individuals who seek a better bottom line for their portfolios.
| Title: | Writer, market consultant |
| Company: | Linear Trading Systems LLC |
| Jacksonville, FL 32217 | |
| Phone # for sales: | 904-239-9564 |
| E-mail address: | lineartradingsys@gmail.com |
Traders' Resource Links | |
| Linear Trading Systems LLC has not added any product or service information to TRADERS' RESOURCE. | |
Click here for more information about our publications!
Comments
Date: 09/29/09Rank: 2Comment:

Request Information From Our Sponsors
- StockCharts.com, Inc.
- Candle Patterns
- Candlestick Charting Explained
- Intermarket Technical Analysis
- John Murphy on Chart Analysis
- John Murphy's Chart Pattern Recognition
- John Murphy's Market Message
- MurphyExplainsMarketAnalysis-Intermarket Analysis
- MurphyExplainsMarketAnalysis-Visual Analysis
- StockCharts.com
- Technical Analysis of the Financial Markets
- The Visual Investor
- VectorVest, Inc.
- Executive Premier Workshop
- One-Day Options Course
- OptionsPro
- Retirement Income Workshop
- Sure-Fire Trading Systems (VectorVest, Inc.)
- Trading as a Business Workshop
- VectorVest 7 EOD
- VectorVest 7 RealTime/IntraDay
- VectorVest AutoTester
- VectorVest Educational Services
- VectorVest OnLine
- VectorVest Options Analyzer
- VectorVest ProGraphics v6.0
- VectorVest ProTrader 7
- VectorVest RealTime Derby Tool
- VectorVest Simulator
- VectorVest Variator
- VectorVest Watchdog
