HOT TOPICS LIST
- MACD
- Fibonacci
- RSI
- Gann
- ADXR
- Stochastics
- Volume
- Triangles
- Futures
- Cycles
- Volatility
- ZIGZAG
- MESA
- Retracement
- Aroon
INDICATORS LIST
LIST OF TOPICS
PRINT THIS ARTICLE
by Chaitali Mohile
The technical chart of General Electric shows trend reversal indications.
Position: Buy
Chaitali Mohile
Active trader in the Indian stock markets since 2003 and a full-time writer. Trading is largely based upon technical analysis.
PRINT THIS ARTICLE
ASCENDING TRIANGLES
GE Undergoes Trend Reversal
09/24/09 10:23:29 AMby Chaitali Mohile
The technical chart of General Electric shows trend reversal indications.
Position: Buy
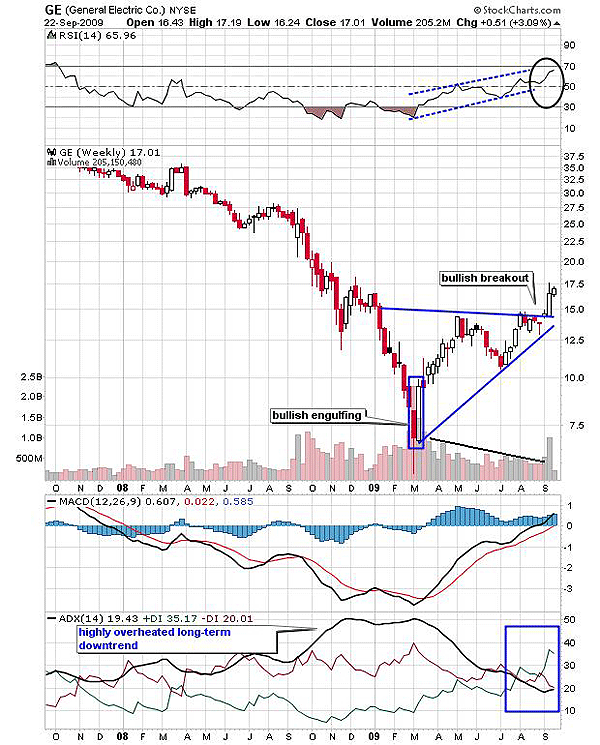
| Due to highly bearish conditions on the weekly time frame, the long bearish rally of General Electric Co (GE) settled at an all-time low at $7.50. A huge bullish candle wrapped the previous bearish candle, forming a bullish engulfing candlestick pattern in Figure 1. Although the bullish engulfing is a bullish reversal formation, it needs a confirmation. If the oscillators or the other tools used to confirm the analysis also suggest trend reversal conditions, then the candlestick patterns would be the best technique to follow. |
| In Figure 1, the average directional movement index (ADX) (14) was highly overheated for more than four months, suggesting a downtrend reversal. The two peaks above the 50 levels suggest that the ADX (14) is not comfortably carrying the bearish trend any further. The relative strength index (RSI) (14) was oversold and the moving average convergence/divergence (MACD) (12,26,9) shifted above the trigger line, indicating a bullish crossover in negative territory. Thus, all the three indicators confirmed the trend reversal situation that the bullish engulfing pattern required. |

|
| FIGURE 1: GE, WEEKLY. Since the ascending triangle is formed in the downtrend, the pattern is the major trend reversal for GE. The bullish breakout would reach an estimated target of $21.50. |
| Graphic provided by: StockCharts.com. |
| |
| Therefore, GE surged toward the previous bearish consolidation range near $15. After hitting resistance at $15 in Figure 1, the stock retraced back a few points and again moved upward. This formed a bullish reversal formation -- an ascending triangle. We can see that the volume has gradually dropped due to the narrowed range of the triangle, reconfirming the formation. GE has formed an ascending triangle in the downtrend, which could indicate a trend reversal. Recently, the pattern has broken upward, offering a good investment opportunity for traders as well as investors. Meanwhile, the RSI (14) has broken above the 50 levels and the MACD (12,26,9) is likely to establish support at the zero line. Thus, the fresh long position has technical support. In addition, the ADX (14) would soon reverse in an uptrend above the 20 levels. |
| Hence, traders can stay long with the target of $21.50 (15 - 7.50 = 6.50 + 15 = 21.5). The target is calculated by adding the length of the triangle to the breakout point. Since the overall downtrend of the financial markets is reversing, traders might locate many such trend reversal formations. Under such circumstances, traders might consider this particular writeup as guidelines for setting up the trade. |
Active trader in the Indian stock markets since 2003 and a full-time writer. Trading is largely based upon technical analysis.
| Company: | Independent |
| Address: | C1/3 Parth Indraprasth Towers. Vastrapur |
| Ahmedabad, Guj 380015 | |
| E-mail address: | chaitalimohile@yahoo.co.in |
Traders' Resource Links | |
| Independent has not added any product or service information to TRADERS' RESOURCE. | |
Click here for more information about our publications!
Comments
Date: 09/25/09Rank: 3Comment:
Date: 10/05/09Rank: 5Comment:

Request Information From Our Sponsors
- StockCharts.com, Inc.
- Candle Patterns
- Candlestick Charting Explained
- Intermarket Technical Analysis
- John Murphy on Chart Analysis
- John Murphy's Chart Pattern Recognition
- John Murphy's Market Message
- MurphyExplainsMarketAnalysis-Intermarket Analysis
- MurphyExplainsMarketAnalysis-Visual Analysis
- StockCharts.com
- Technical Analysis of the Financial Markets
- The Visual Investor
- VectorVest, Inc.
- Executive Premier Workshop
- One-Day Options Course
- OptionsPro
- Retirement Income Workshop
- Sure-Fire Trading Systems (VectorVest, Inc.)
- Trading as a Business Workshop
- VectorVest 7 EOD
- VectorVest 7 RealTime/IntraDay
- VectorVest AutoTester
- VectorVest Educational Services
- VectorVest OnLine
- VectorVest Options Analyzer
- VectorVest ProGraphics v6.0
- VectorVest ProTrader 7
- VectorVest RealTime Derby Tool
- VectorVest Simulator
- VectorVest Variator
- VectorVest Watchdog
