HOT TOPICS LIST
- MACD
- Fibonacci
- RSI
- Gann
- ADXR
- Stochastics
- Volume
- Triangles
- Futures
- Cycles
- Volatility
- ZIGZAG
- MESA
- Retracement
- Aroon
INDICATORS LIST
LIST OF TOPICS
PRINT THIS ARTICLE
by Mike Carr, CMT
An exchange traded fund can be used to spot trends in cash and offer insight into investor sentiment.
Position: N/A
Mike Carr, CMT
Mike Carr, CMT, is a member of the Market Technicians Association, and editor of the MTA's newsletter, Technically Speaking. He is also the author of "Smarter Investing in Any Economy: The Definitive Guide to Relative Strength Investing," and "Conquering the Divide: How to Use Economic Indicators to Catch Stock Market Trends."
PRINT THIS ARTICLE
STRATEGIES
Analyzing Cash
09/23/09 09:56:55 AMby Mike Carr, CMT
An exchange traded fund can be used to spot trends in cash and offer insight into investor sentiment.
Position: N/A
| While institutions will turn to Treasuries, the dollar, or gold at times of panic, individuals usually think of cash as their first safe haven as they consider alternative investments. That means looking at how cash is performing as an investment should provide some insight into what the average investor is thinking. |
| The WisdomTree US Short-Term Government Income (USY) exchange traded fund (ETF) seeks to generate current income and total return in a manner consistent with low fluctuations in principal value by investing primarily in very short-tern government securities. The low fluctuation in value makes this ETF a good proxy for cash. |
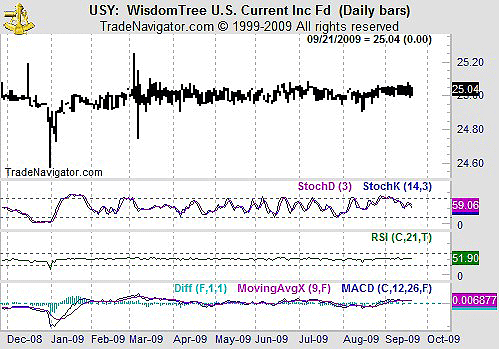
| Typical technical analysis tools are shown in Figure 1. The small changes in value that occur on a daily basis make this a poor trading vehicle. Stochastics, relative strength index (RSI), and the moving average convergence/divergence (MACD) offer no real insights into a stock with such small trading ranges. This chart does show that stochastics appears to be a more responsive indicator -- potentially useful knowledge for active traders. |

|
| FIGURE 1: USY, DAILY. Traditional technical indicators require price fluctuations to be effective. |
| Graphic provided by: Trade Navigator. |
| |
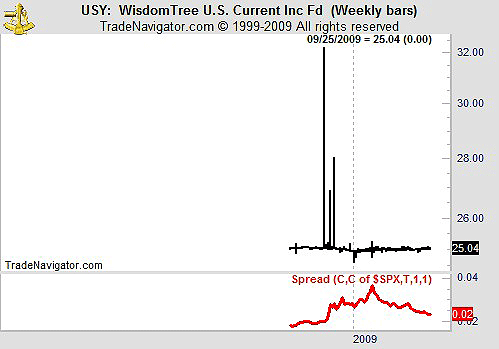
| In Figure 2, we look at a weekly chart of USY with a ratio of its price changes compared to the Standard & Poor's 500. Here we do find useful information. When the ratio is rising, investors prefer the safety of cash to the uncertainty of stocks. As the ratio declines, it is a good time to own stocks. |

|
| FIGURE 2: USY, WEEKLY. Relative strength analysis of USY offers insight into investor psychology. |
| Graphic provided by: Trade Navigator. |
| |
| The peak in the ratio of USY/SPY occurred the first week of March, the bottom in stocks. This indicator can be used by traders as an adjunct to more traditional sentiment analysis to see what investors are doing with their money in real time. |
Mike Carr, CMT, is a member of the Market Technicians Association, and editor of the MTA's newsletter, Technically Speaking. He is also the author of "Smarter Investing in Any Economy: The Definitive Guide to Relative Strength Investing," and "Conquering the Divide: How to Use Economic Indicators to Catch Stock Market Trends."
| Website: | www.moneynews.com/blogs/MichaelCarr/id-73 |
| E-mail address: | marketstrategist@gmail.com |
Click here for more information about our publications!
Comments
Date: 09/24/09Rank: 1Comment:

Request Information From Our Sponsors
- StockCharts.com, Inc.
- Candle Patterns
- Candlestick Charting Explained
- Intermarket Technical Analysis
- John Murphy on Chart Analysis
- John Murphy's Chart Pattern Recognition
- John Murphy's Market Message
- MurphyExplainsMarketAnalysis-Intermarket Analysis
- MurphyExplainsMarketAnalysis-Visual Analysis
- StockCharts.com
- Technical Analysis of the Financial Markets
- The Visual Investor
- VectorVest, Inc.
- Executive Premier Workshop
- One-Day Options Course
- OptionsPro
- Retirement Income Workshop
- Sure-Fire Trading Systems (VectorVest, Inc.)
- Trading as a Business Workshop
- VectorVest 7 EOD
- VectorVest 7 RealTime/IntraDay
- VectorVest AutoTester
- VectorVest Educational Services
- VectorVest OnLine
- VectorVest Options Analyzer
- VectorVest ProGraphics v6.0
- VectorVest ProTrader 7
- VectorVest RealTime Derby Tool
- VectorVest Simulator
- VectorVest Variator
- VectorVest Watchdog
