HOT TOPICS LIST
- MACD
- Fibonacci
- RSI
- Gann
- ADXR
- Stochastics
- Volume
- Triangles
- Futures
- Cycles
- Volatility
- ZIGZAG
- MESA
- Retracement
- Aroon
INDICATORS LIST
LIST OF TOPICS
PRINT THIS ARTICLE
by Koos van der Merwe
The company is loved, the athletic clothing sold popular. With the financial crises, the price dropped from a high of $58.87 in October 2007 to a low of $5.60 by March 2009. It is now trading at $26. Is it worth a buy?
Position: Hold
Koos van der Merwe
Has been a technical analyst since 1969, and has worked as a futures and options trader with First Financial Futures in Johannesburg, South Africa.
PRINT THIS ARTICLE
ELLIOTT WAVE
Time To Take Profits In Lululemon?
09/25/09 12:18:06 PMby Koos van der Merwe
The company is loved, the athletic clothing sold popular. With the financial crises, the price dropped from a high of $58.87 in October 2007 to a low of $5.60 by March 2009. It is now trading at $26. Is it worth a buy?
Position: Hold
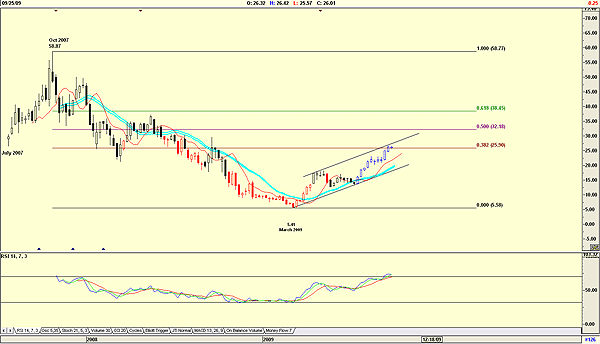
| Lululemon came to the market in July 2007 at a price of $25.90. The share price rose quickly to a high of $58.87 by October 2007 but then started falling as the world economic crises hit and investors had to offload assets. Small investors and loyal customers held their shares, however, and slowly started to accumulate as the share hit $5.60, believing in a company that sold them what they needed and wanted. |
| Figure 1, a weekly chart of Lulu Lemon, shows how the share price has risen and is currently testing the 38.2% retracement level. The realtive strength index (RSI) signal is oversold, suggesting a possible top in the medium to long term. |

|
| FIGURE 1: LULU, WEEKLY |
| Graphic provided by: AdvancedGET. |
| |
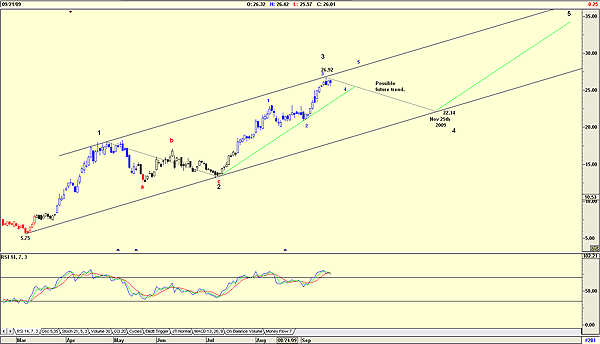
| Figure 2, a daily chart, is also suggesting weakness ahead. The RSI is oversold but has not yet given a sell signal. The suggested future trend for the weakness is shown on the chart, with a possible date for a buy signal as it finds support on the trendline. I am also showing a short-term trendline (green) as a possible support level, should the RSI sell signal not materialize as in the recent past. I have included a wave count, suggesting that the price could be moving into a wave 4 down. The wave count, however, suggests that the share price will only turn sometime in the future, because it could be turning into a wave 4 of a wave 3, with wave 5 of wave 3 still to come. We would therefore move the minor trendline from the new high to suggest a date for the low of wave 4. This is a share that is not a buy at present levels, but it can be placed on your watchlist. Its recovery has been quite remarkable, and it could be a good investment as the market continues to recover. Short-term weakness, though, is on the cards, presenting a buy opportunity with a target well over $30. |

|
| FIGURE 2: LULU, DAILY |
| Graphic provided by: AdvancedGET. |
| |
Has been a technical analyst since 1969, and has worked as a futures and options trader with First Financial Futures in Johannesburg, South Africa.
| Address: | 3256 West 24th Ave |
| Vancouver, BC | |
| Phone # for sales: | 6042634214 |
| E-mail address: | petroosp@gmail.com |
Click here for more information about our publications!
PRINT THIS ARTICLE

Request Information From Our Sponsors
- StockCharts.com, Inc.
- Candle Patterns
- Candlestick Charting Explained
- Intermarket Technical Analysis
- John Murphy on Chart Analysis
- John Murphy's Chart Pattern Recognition
- John Murphy's Market Message
- MurphyExplainsMarketAnalysis-Intermarket Analysis
- MurphyExplainsMarketAnalysis-Visual Analysis
- StockCharts.com
- Technical Analysis of the Financial Markets
- The Visual Investor
- VectorVest, Inc.
- Executive Premier Workshop
- One-Day Options Course
- OptionsPro
- Retirement Income Workshop
- Sure-Fire Trading Systems (VectorVest, Inc.)
- Trading as a Business Workshop
- VectorVest 7 EOD
- VectorVest 7 RealTime/IntraDay
- VectorVest AutoTester
- VectorVest Educational Services
- VectorVest OnLine
- VectorVest Options Analyzer
- VectorVest ProGraphics v6.0
- VectorVest ProTrader 7
- VectorVest RealTime Derby Tool
- VectorVest Simulator
- VectorVest Variator
- VectorVest Watchdog
