HOT TOPICS LIST
- MACD
- Fibonacci
- RSI
- Gann
- ADXR
- Stochastics
- Volume
- Triangles
- Futures
- Cycles
- Volatility
- ZIGZAG
- MESA
- Retracement
- Aroon
INDICATORS LIST
LIST OF TOPICS
PRINT THIS ARTICLE
by Chaitali Mohile
The US Paper Index is a good example of the consolidated formations and strength in a consolidation range.
Position: Hold
Chaitali Mohile
Active trader in the Indian stock markets since 2003 and a full-time writer. Trading is largely based upon technical analysis.
PRINT THIS ARTICLE
CONSOLID FORMATION
The US Paper Index Breakout
09/22/09 09:36:38 AMby Chaitali Mohile
The US Paper Index is a good example of the consolidated formations and strength in a consolidation range.
Position: Hold
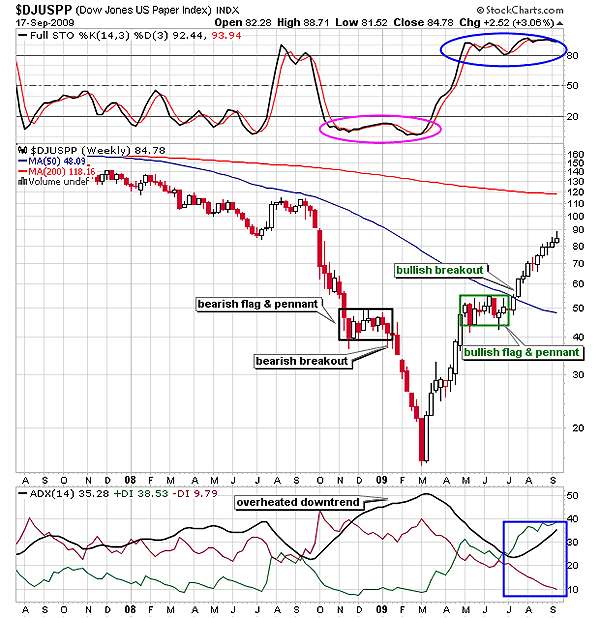
| Identifying support and resistance levels is the most important technique for any technical analyst to learn. Support and resistance formed by previous highs and lows, bearish or bullish consolidations, is common but is also the most reliable tool found on technical charts. One such example is the Dow Jones US Paper Index ($DJUSPP). Every stock or index consolidates to fuel itself for its journey; however, the direction of the rally does not matter. A bearish rally as well as bullish action needs to consolidate before proceeding. In Figure 1, $DJUSPP consolidated during its bearish phase in 2008. According to the average directional movement index (ADX)(14), the index was in a robust downtrend. The consolidation after a bearish rally of about 60 points (110 minus 50) formed a bearish continuation pattern -- a bearish flag & pennant formation in the range of 50 and 40. After a bearish breakout, $DJUSPP resumed its prior downward move. Due to the consolidation in the range of 50 and 40, the index could rest for a while and gather additional bearish strength for the future rally. As a matter of fact, if the stock or index does not consolidate, then the rally might lose its steam by the time it reaches its destination. |

|
| FIGURE 1: DJUSPP, WEEKLY |
| Graphic provided by: StockCharts.com. |
| |
| In Figure 1, the bearish flag & pennant formation encouraged the bears to tighten their seat belts in anticipation of the further corrective rally. Gradually, $DJUSPP reached the all-time low at 15.11 levels. Meanwhile, the full stochastic (14,3,3) that moved flat in an overbought area surged, initiating a new bullish rally and suggesting the possibility of a fresh long trade as well. The ADX (14) turned highly overheated, suggesting the downtrend reversal conditions. Thus, a fresh bullish rally was geared up by $DJUSPP from the new low at 15.11. |
| The new rally soon recovered almost 50 levels with a huge demand. The index changed the direction by moving sideways near 45 and 55 ranges. In Figure 1, we can see that the rally consolidated approximately at the previous bearish consolidation range that is 50 and 40. This reflects the strength of the support-resistance areas. Any consolidation range of the previous rally might act as a hurdle or support for the ongoing rally. But they reflect massive differences in technical conditions for the existing rally. In Figure 1, the previous bearish consolidation formed the bearish flag & pennant formation and the bullish continuation pattern during the recovery. |
| In Figure 1, $DJUSPP breached the bullish flag & pennant pattern as well as the 50-day moving average (MA) resistance. Thus, the breakout was robust, dragging the index higher. The long bullish candles in Figure 1 signified the strength in the rally, but we can see that the size of the candles shrank. However, the stochastic oscillator and ADX (14) are comfortable in their bullish territory. Although the size of the candles changed, the bullish rally would gradually move higher. The ultimate target of the upward movement is the 200-day moving average (MA) resistance. |

|
| FIGURE 2: DJUSPP, DAILY |
| Graphic provided by: StockCharts.com. |
| |
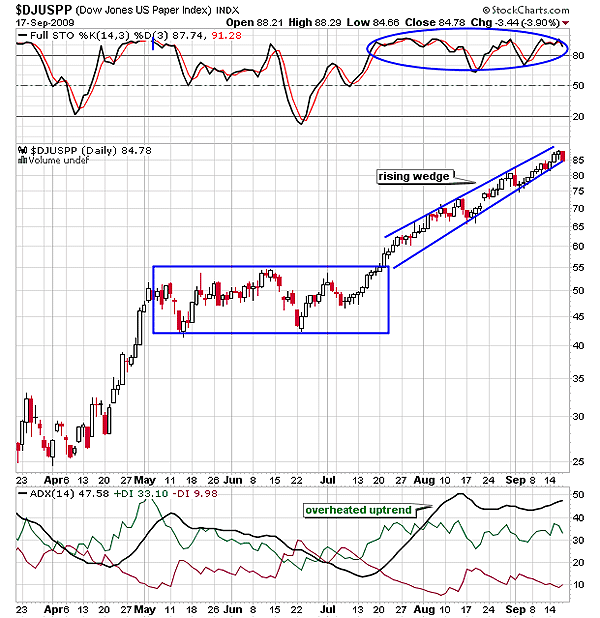
| On the daily time frame $DJUSPP has formed a bearish reversal formation, a rising wedge. In addition, the uptrend in Figure 2 is highly overheated as the ADX (14) rallies consistently above 45 levels. The stochastic oscillator is shaky in an overbought region. Therefore, the wedge is likely to break downward. Thus, the bullish rally on the weekly time frame would slow down but the long-term target of the 200-day MA is achievable. |
Active trader in the Indian stock markets since 2003 and a full-time writer. Trading is largely based upon technical analysis.
| Company: | Independent |
| Address: | C1/3 Parth Indraprasth Towers. Vastrapur |
| Ahmedabad, Guj 380015 | |
| E-mail address: | chaitalimohile@yahoo.co.in |
Traders' Resource Links | |
| Independent has not added any product or service information to TRADERS' RESOURCE. | |
Click here for more information about our publications!
PRINT THIS ARTICLE

Request Information From Our Sponsors
- StockCharts.com, Inc.
- Candle Patterns
- Candlestick Charting Explained
- Intermarket Technical Analysis
- John Murphy on Chart Analysis
- John Murphy's Chart Pattern Recognition
- John Murphy's Market Message
- MurphyExplainsMarketAnalysis-Intermarket Analysis
- MurphyExplainsMarketAnalysis-Visual Analysis
- StockCharts.com
- Technical Analysis of the Financial Markets
- The Visual Investor
- VectorVest, Inc.
- Executive Premier Workshop
- One-Day Options Course
- OptionsPro
- Retirement Income Workshop
- Sure-Fire Trading Systems (VectorVest, Inc.)
- Trading as a Business Workshop
- VectorVest 7 EOD
- VectorVest 7 RealTime/IntraDay
- VectorVest AutoTester
- VectorVest Educational Services
- VectorVest OnLine
- VectorVest Options Analyzer
- VectorVest ProGraphics v6.0
- VectorVest ProTrader 7
- VectorVest RealTime Derby Tool
- VectorVest Simulator
- VectorVest Variator
- VectorVest Watchdog
