HOT TOPICS LIST
- MACD
- Fibonacci
- RSI
- Gann
- ADXR
- Stochastics
- Volume
- Triangles
- Futures
- Cycles
- Volatility
- ZIGZAG
- MESA
- Retracement
- Aroon
INDICATORS LIST
LIST OF TOPICS
PRINT THIS ARTICLE
by Koos van der Merwe
Last week I offered readers a wave count of the Standard & Poor's 500, and my projection for the future. This week I discuss the NASDAQ index.
Position: Accumulate
Koos van der Merwe
Has been a technical analyst since 1969, and has worked as a futures and options trader with First Financial Futures in Johannesburg, South Africa.
PRINT THIS ARTICLE
ELLIOTT WAVE
The NASDAQ Index
09/21/09 08:59:47 AMby Koos van der Merwe
Last week I offered readers a wave count of the Standard & Poor's 500, and my projection for the future. This week I discuss the NASDAQ index.
Position: Accumulate
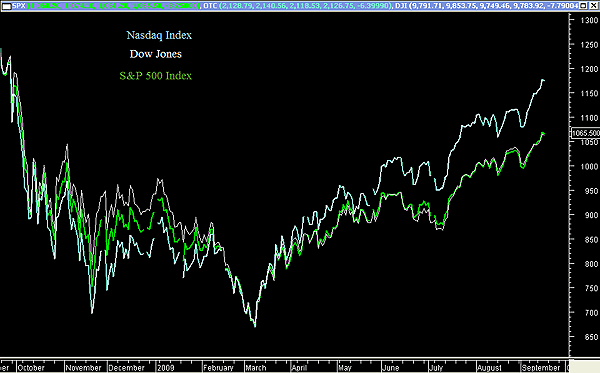
| The NASDAQ, Dow Jones Industrial Average (DJIA), and S&P 500 all move in tandem. On occasion, one index may fall or rise quicker than the other, but this does not happen that frequently. This can be seen in Figure 1. |

|
| FIGURE 1: NASDAQ, DJIA, AND S&P 500 |
| Graphic provided by: MetaStock. |
| |
| Figure 1 shows how the three indexes moved relative to each other. On the way down, the NASDAQ (light blue) led the way, followed by the S&P 500 (green) , with the DJIA (white) showing greater strength. However, approaching the final leg down, all three indexes bottomed together. Recovering from that low, the NASDAQ appears to have taken the lead, recovering far quicker. The S&P 500 and the DJIA are tracing the same path. In fact, on the chart, it is difficult to distinguish between the two. |

|
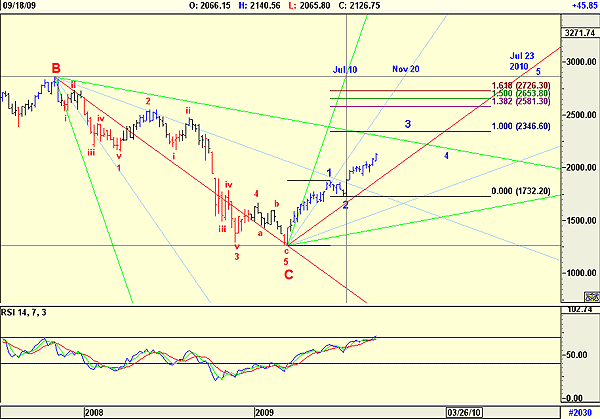
| FIGURE 2: NASDAQ, WEEKLY |
| Graphic provided by: AdvancedGET. |
| |
| Figure 2 is a weekly chart of the NASDAQ and shows that the NASDAQ has completed its C-wave bottom, and is currently in wave 3 of wave I in a new bull market. The chart is almost identical to the chart of the S&P 500 of my last report. In the chart I am showing the following: - A wave 3 should not be shorter than a wave 1. If it is, then wave 5 will be shorter than wave 3, but this wave type happens very rarely. In Figure 2, I have shown three targets for wave 3. The first target is 2346.60, where wave 3 is equal to wave 1. The other targets are 2581.30 (1.382), 2653.80 (1.50), and 2726.30 (1.618). - Gann fans. The fans are drawn to project possible turning points. The down fan is drawn so that the 1 x 1 line moves from the high to the low. The up fan is using the same parameters as the down fan. Where the Gann fan lines cross the horizontal drawn from the high wave B, dates for possible turning points are shown. The chart shows that the low of July 10, 2009, was correct. Future dates to watch for are November 20, 2009, and July 23, 2010. November 20 could be the top of wave 3 and July 23, 2010, the top of wave 5. - The relative strength index (RSI), which is in a bullish trend. To conclude, the NASDAQ is in a bull trend, in a wave 3 of a wave I. Wave 4 lies ahead, with the Gann turning date suggesting that wave 3 should top November 20, or this date could be the wave 4 bottom. Because wave 2 looks like a simple wave, wave 4 could be a complicated wave. If the Gann turning points shown on the chart are correct, then we could expect wave I to be completed in July 2010. This will be followed by a wave II down, which could be a 72% correction. Until that date, let us enjoy the bull trend. |
Has been a technical analyst since 1969, and has worked as a futures and options trader with First Financial Futures in Johannesburg, South Africa.
| Address: | 3256 West 24th Ave |
| Vancouver, BC | |
| Phone # for sales: | 6042634214 |
| E-mail address: | petroosp@gmail.com |
Click here for more information about our publications!
Comments
Date: 09/21/09Rank: 4Comment: I believe the Nasdaq did not take out the Nov low. My RS study showed it started to gain RS against S P500 in Dec 08. Is that what your work shows?
Date: 09/23/09Rank: 2Comment:
Date: 11/11/09Rank: 5Comment:

Request Information From Our Sponsors
- StockCharts.com, Inc.
- Candle Patterns
- Candlestick Charting Explained
- Intermarket Technical Analysis
- John Murphy on Chart Analysis
- John Murphy's Chart Pattern Recognition
- John Murphy's Market Message
- MurphyExplainsMarketAnalysis-Intermarket Analysis
- MurphyExplainsMarketAnalysis-Visual Analysis
- StockCharts.com
- Technical Analysis of the Financial Markets
- The Visual Investor
- VectorVest, Inc.
- Executive Premier Workshop
- One-Day Options Course
- OptionsPro
- Retirement Income Workshop
- Sure-Fire Trading Systems (VectorVest, Inc.)
- Trading as a Business Workshop
- VectorVest 7 EOD
- VectorVest 7 RealTime/IntraDay
- VectorVest AutoTester
- VectorVest Educational Services
- VectorVest OnLine
- VectorVest Options Analyzer
- VectorVest ProGraphics v6.0
- VectorVest ProTrader 7
- VectorVest RealTime Derby Tool
- VectorVest Simulator
- VectorVest Variator
- VectorVest Watchdog
