HOT TOPICS LIST
- MACD
- Fibonacci
- RSI
- Gann
- ADXR
- Stochastics
- Volume
- Triangles
- Futures
- Cycles
- Volatility
- ZIGZAG
- MESA
- Retracement
- Aroon
INDICATORS LIST
LIST OF TOPICS
PRINT THIS ARTICLE
by Mike Carr, CMT
Sometimes indicators just don't work. Typically, it takes a little more than looking at a chart with the default settings of an indicator to be a successful trader.
Position: N/A
Mike Carr, CMT
Mike Carr, CMT, is a member of the Market Technicians Association, and editor of the MTA's newsletter, Technically Speaking. He is also the author of "Smarter Investing in Any Economy: The Definitive Guide to Relative Strength Investing," and "Conquering the Divide: How to Use Economic Indicators to Catch Stock Market Trends."
PRINT THIS ARTICLE
STRATEGIES
Studying Indicators
09/18/09 08:23:33 AMby Mike Carr, CMT
Sometimes indicators just don't work. Typically, it takes a little more than looking at a chart with the default settings of an indicator to be a successful trader.
Position: N/A
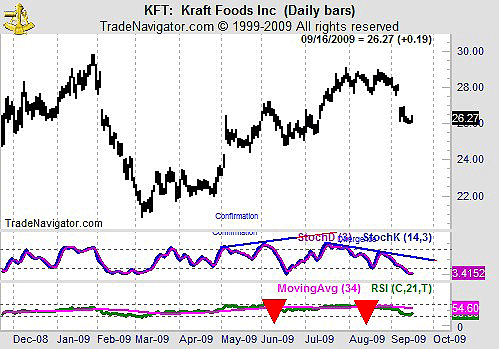
| In Figure 1 we have a daily chart of Kraft (KFT). Like almost all stocks, it is higher than it was at the March 2009 bottom. Many traders use stochastics to identify trading opportunities, and KFT was oversold on this indicator at the bottom and gave a timely buy signal. The stock moved higher in May and the stochastics confirmed the price action. Unfortunately, prices soon fell. Near the September top, the stochastics successfully highlighted a bearish divergence. |

|
| FIGURE 1: KFT, DAILY. Here's Kraft with stochastics and the RSI. |
| Graphic provided by: Trade Navigator. |
| |
| This is typical of the experience of new technicians. Sometimes an indicator works as advertised and at other times it doesn't. In the lower clip, we see the relative strength index (RSI) with a moving average superimposed. Here the idea is to sell if the indicator falls below the moving average. |
| Using that idea, we would not have been led astray by the confirmation in stochastics and would have been out of the long position a few days early when stochastics set up a divergence. |
| The bottom line is that trading is difficult. Using indicators just like the book says to will rarely lead to profits over the long term. Understand what the indicator is designed to do, and then look at how you can modify that to fit your style. In this case, stochastics is actually a slow version of momentum. The RSI is a faster measure of that. Applying the moving average to the RSI lets you see what very few others are, and that could be your trading edge. |
Mike Carr, CMT, is a member of the Market Technicians Association, and editor of the MTA's newsletter, Technically Speaking. He is also the author of "Smarter Investing in Any Economy: The Definitive Guide to Relative Strength Investing," and "Conquering the Divide: How to Use Economic Indicators to Catch Stock Market Trends."
| Website: | www.moneynews.com/blogs/MichaelCarr/id-73 |
| E-mail address: | marketstrategist@gmail.com |
Click here for more information about our publications!
Comments
Date: 09/23/09Rank: 3Comment:

Request Information From Our Sponsors
- StockCharts.com, Inc.
- Candle Patterns
- Candlestick Charting Explained
- Intermarket Technical Analysis
- John Murphy on Chart Analysis
- John Murphy's Chart Pattern Recognition
- John Murphy's Market Message
- MurphyExplainsMarketAnalysis-Intermarket Analysis
- MurphyExplainsMarketAnalysis-Visual Analysis
- StockCharts.com
- Technical Analysis of the Financial Markets
- The Visual Investor
- VectorVest, Inc.
- Executive Premier Workshop
- One-Day Options Course
- OptionsPro
- Retirement Income Workshop
- Sure-Fire Trading Systems (VectorVest, Inc.)
- Trading as a Business Workshop
- VectorVest 7 EOD
- VectorVest 7 RealTime/IntraDay
- VectorVest AutoTester
- VectorVest Educational Services
- VectorVest OnLine
- VectorVest Options Analyzer
- VectorVest ProGraphics v6.0
- VectorVest ProTrader 7
- VectorVest RealTime Derby Tool
- VectorVest Simulator
- VectorVest Variator
- VectorVest Watchdog
