HOT TOPICS LIST
- MACD
- Fibonacci
- RSI
- Gann
- ADXR
- Stochastics
- Volume
- Triangles
- Futures
- Cycles
- Volatility
- ZIGZAG
- MESA
- Retracement
- Aroon
INDICATORS LIST
LIST OF TOPICS
PRINT THIS ARTICLE
by Chaitali Mohile
The PowerShares QQQ Trust was well equipped with the bullish factors to begin a fresh upside rally. Let's check the current and possibly the future strength in the rally.
Position: Buy
Chaitali Mohile
Active trader in the Indian stock markets since 2003 and a full-time writer. Trading is largely based upon technical analysis.
PRINT THIS ARTICLE
CHART ANALYSIS
QQQQ Regains The Lost Levels
09/17/09 12:58:21 PMby Chaitali Mohile
The PowerShares QQQ Trust was well equipped with the bullish factors to begin a fresh upside rally. Let's check the current and possibly the future strength in the rally.
Position: Buy
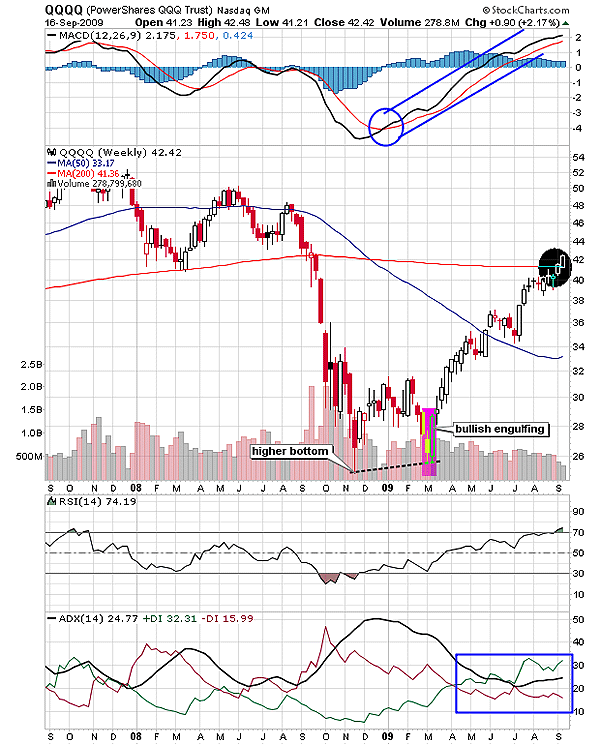
| The weekly chart in Figure 1 of the PowerShares QQQ Trust (QQQQ) would reveal the technical aspects at the initial stage of the bullish rally. A higher bottom on the price chart of QQQQ was the first bullish indication followed by a bullish reversal candlestick formation, a bullish engulfing pattern. A long white candle of the candlestick pattern signifies a robust bullish strength and the developing positive sentiments among traders. If we try to locate the reasons for the higher bottom formation, then an overheated downtrend is what catches the eye. The average directional movement index (ADX) (14) in Figure 1 surged to 50 levels with robust selling pressure indicating the highly overheated downtrend. Since the trend indicator reversed from this level (50), highlighting a trend reversal possibility, the stock formed a higher low. However, the relative strength index (RSI) (14) added the bullish strength by moving above an oversold region at 30 levels. The higher low formed by the oscillator generated a fresh bullish force, supporting the bullish formation on the price chart. |

|
| FIGURE 1: QQQQ, WEEKLY. The 200-day MA breakout target would be the previous highs like $48, $52. |
| Graphic provided by: StockCharts.com. |
| |
| The bullish crossover of the moving average convergence/divergence (MACD) (12,26,9) in negative territory was another major bullish reversal indication. We can see in Figure 1 that the momentum indicator turned positive and ascended toward the center line (zero line). Thus, the declining downtrend, the higher lows of the RSI (14) and the positive MACD (12,26,9) encouraged the bullish rally in March 2009. Thereafter, there was no looking back for QQQQ. The first major short-term resistance of the 50-day moving average (MA) was violated during the upward journey. According to Figure 1, the trading session of September 16 closed above the 200-day moving average (MA) on bullish notes. Currently, the 200-day MA is the new strong support. The ADX (14) has slowly moved above the 20 levels with steadily increasing buying pressure, indicating a developing uptrend. The RSI (14) is healthily overbought and the MACD (12,26,9) is positive. In addition, the current bullish trend of the financial markets across the world would help QQQQ sustain above the newly converted support of the 200-day MA and rally higher in the near future. |
| The fresh 200-day MA breakout with the previous highs as the target can be a good buy setup for long-term traders. |

|
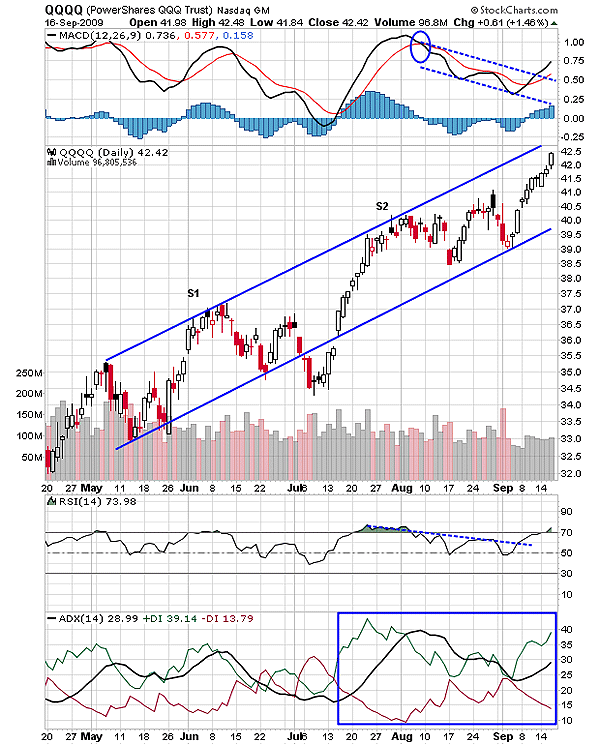
| FIGURE 2: QQQQ, DAILY. The MACD (12,26,9) descended after a bearish crossover, forming lower highs and lower lows. The upward breakout of the momentum indicator is a good indication of developing bullish momentum. |
| Graphic provided by: StockCharts.com. |
| |
| The daily time frame would help us strike an intraday trade. The ascending channel in Figure 2 would be an entry-exit point for QQQQ. Earlier, the upper trendline was challenged twice, in June (S1) and in late July-early August (S2). The stock consolidated there, trying to break upwars. S1 and S2 were the profit-taking levels for buyers, and entry points for sellers. Currently, the bullish rally from the lower trendline at $39.50 has moved closer to the upper trendline, gaining a profit of $4. The descending MACD (12,26,9) has surged above the channel resistance (see Figure 2), and the RSI (14) has slipped in an overbought zone. The ADX (14) in Figure 2 is indicating the developing uptrend, and therefore, the current rally has more upside. The upper and lower trendlines can be extended to identify the future trading system. |
| But if the upper trendline is breached, then fresh demand pressure might get generated. So those already long can add more to their position, and the fresh traders can trigger a buy setup. |
Active trader in the Indian stock markets since 2003 and a full-time writer. Trading is largely based upon technical analysis.
| Company: | Independent |
| Address: | C1/3 Parth Indraprasth Towers. Vastrapur |
| Ahmedabad, Guj 380015 | |
| E-mail address: | chaitalimohile@yahoo.co.in |
Traders' Resource Links | |
| Independent has not added any product or service information to TRADERS' RESOURCE. | |
Click here for more information about our publications!
PRINT THIS ARTICLE

Request Information From Our Sponsors
- StockCharts.com, Inc.
- Candle Patterns
- Candlestick Charting Explained
- Intermarket Technical Analysis
- John Murphy on Chart Analysis
- John Murphy's Chart Pattern Recognition
- John Murphy's Market Message
- MurphyExplainsMarketAnalysis-Intermarket Analysis
- MurphyExplainsMarketAnalysis-Visual Analysis
- StockCharts.com
- Technical Analysis of the Financial Markets
- The Visual Investor
- VectorVest, Inc.
- Executive Premier Workshop
- One-Day Options Course
- OptionsPro
- Retirement Income Workshop
- Sure-Fire Trading Systems (VectorVest, Inc.)
- Trading as a Business Workshop
- VectorVest 7 EOD
- VectorVest 7 RealTime/IntraDay
- VectorVest AutoTester
- VectorVest Educational Services
- VectorVest OnLine
- VectorVest Options Analyzer
- VectorVest ProGraphics v6.0
- VectorVest ProTrader 7
- VectorVest RealTime Derby Tool
- VectorVest Simulator
- VectorVest Variator
- VectorVest Watchdog
